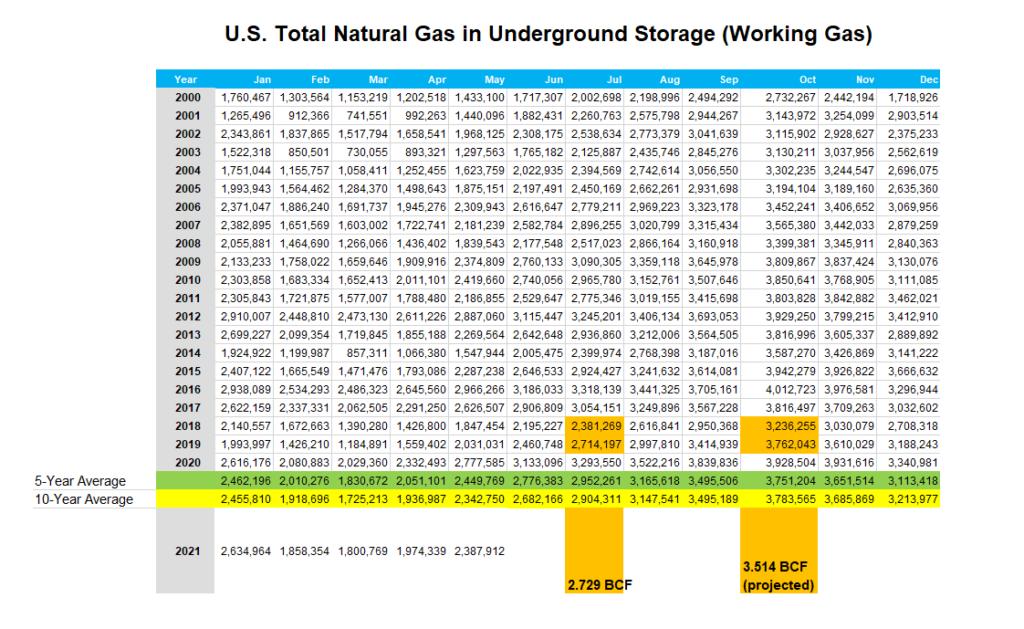
For natural gas report week August 12, 2021, the EIA reported a net increase in storage of 49 Bcf. The injection was in line with forecasts which ranged from 41 Bcf to 58 Bcf and averaged 47 Bcf. In comparison, last year for the same week there was an injection of 55 Bcf and the five-year average is an injection of 42 Bcf.
Working gas in storage was 2,776 Bcf as of Friday, August 6, 2021 per EIA estimates. Inventory was 548 Bcf (-16.5%) less than last year for the same week and 178 Bcf (-6.0%) below the five-year average of 2,954 Bcf.
Natural Gas Market Recap
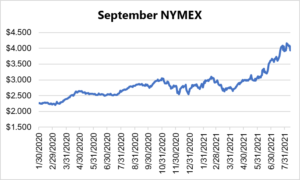
September NYMEX
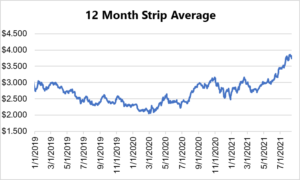
12 Month Strip
Seasonal Strips

Natural Gas Report – August 12, 2021
Fundamentals
Overall supply averaged 97.9 Bcf/d last week as production fell by 0.1% and imports from Canada declined by 4.1%.
Total demand grew by 2.3% from the prior report week, averaging 90.6 Bcf/d. Residential-commercial and power generation demand increased by 5.6% and 3.2%, respectively. Meanwhile, LNG pipeline receipts averaged 9.9 Bcf/d, falling 0.6 Bcf/d week over week.
Up to this point in injection season, the average rate of injections is 13% lower than the five-year average. If the rate of injections matched the five-year average of 8.9 Bcf/d, inventory would be 3,541 Bcf at the close of refill season. That’s 178 Bcf lower than the five-year average of 3,719 Bcf.
Natural Gas Prices
Weather and disappointing storage injections appear to be major drivers of natural gas prices of late. Above average temperatures contributed to increased demand for power generation to satisfy cooling need. The increased demand, with sluggish production, translated to injections that fell short of analysts expectations. It’s also put us on track to close injection season at a 170 – 180 Bcf deficit to the five-year average.
Now, as the heat bubble shows signs of deflating, so too has the market, with futures prices dropping more than ten cents across the board.
DEC21, settled at $4.139/Dth, down 17.7 cents
JAN22, settled at $4.208/Dth, down 17.5 cents
FEB22, settled at $4.130/Dth, down 16.7 cents
MAR22, settled at $3.873/Dth down 14.7 cents
APR22, settled at $3.345/Dth down 2.4 cents
Strips
24 Month, settled at $3.514/Dth up 8.2 cents
36 Month, settled at $3.298/Dth up 7.9 cents
The Sky Is Falling? Chicken Little and Natural Gas Projections
So what should we look for as injection season wanes?
Weather
Next week is expected to bring above-average temperatures for the Northeast and milder weather throughout the rest of the country. Absent a prolonged, extreme weather event, it’s unlikely the overall impact to storage will be enough to have a long-term impact on prices.
The Timeline
With less than a dozen weeks left of injection season, end-of-season storage totals will likely fall short of the five-year average. While a hot week might spark prices temporarily, at this point, there’s no clear scenario that results in such a long-term price outlook.
Why? The end-of-season storage deficit to five-year just isn’t alarming right now. Based on available EIA data as of the end of July and examined in context, we’re in line with 2018 and 2019 levels right now and those levels still resulted in prices well below the $3.00/Dth mark. What’s more is that production is still outpacing last year.
Look for early winter forecasts. Should early outlooks suggest a colder-than-normal winter, then the end-of-season deficit may start to matter. Above-average withdrawals early into winter heating season will fuel bullish market activity.
Natural Gas Prices and Demand
Higher natural gas prices may result in decreased power generation demand, at least domestically as natural gas trades off with more affordable renewables and coal in the generation mix. However, higher international natural gas prices will mean continued LNG and pipeline export demand.
Do you have the best natural gas contract for your business?
We can help you evaluate your current contract and explore your natural gas buying options. Call us at 866-646-7322 for a no-cost, no-obligation analysis today.