For natural gas report week, August 27, 2020, the EIA reported a net increase in storage of 45 Bcf. The build was in line with forecasts of injections ranging from 37 Bcf to 58 Bcf, averaging 45 Bcf. Last year for the same week there was an injection of 60 Bcf and the five-year average is 49 Bcf.
Working gas in storage was 3,420 Bcf as of Friday, August 21st, 2020 per EIA estimates. Inventory was 580 Bcf (20.4%) higher than last year for the same week and 438 Bcf (14.7%) more than the five-year average of 2,982 Bcf.
Natural Gas Market Recap
October NYMEX
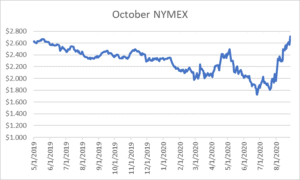
September NYMEX: Moved off the board Thursday, August 27th, settling the month at $2.579/Dth.
October NYMEX: Settled Thursday at $2.710/Dth up 13.6 cents from Wednesday’s close at $2.574/Dth.
12 Month Strip
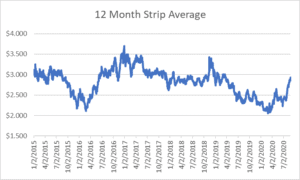
Settled Thursday at $2.926/Dth, up 7.7 cents from the prior week.
Seasonal Strips
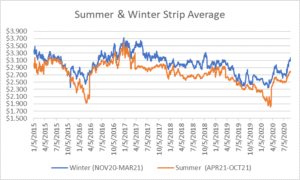
The winter strip (NOV20-MAR21) settled Thursday at $3.174/Dth, up 8.0 cents from the week prior. Looking forward to next summer (APR21-OCT21), the strip settled Thursday at $2.800/Dth, up 1.9 cents from the week prior.
Natural Gas Weekly
Natural Gas Report – August 27, 2020
Natural Gas Fundamentals
Overall supply averaged 94.0 Bcf/d last week with production declining by 1.0%. Meanwhile, imports from Canada fell by 10.3%.
The average rate of injections into storage is 10% more than that of the five-year average for this point in the refill season. If the injection rate matched the five-year average of 10.4 Bcf/d through the end of refill season (October 31st), withdrawal season would begin with 4,161 Bcf in storage, which is 438 Bcf higher than the five-year average of 3,723 Bcf.
Total demand grew by 0.8% from the prior report week, averaging 87.9 Bcf/d. Power generation and residential-commercial consumption increased by 1.3% and 0.8%, respectively. Industrial demand fell by 0.2% and exports to Mexico rose by 8.0%.
LNG pipeline receipts are down by 0.5 Bcf/d. Seven LNG vessels with a combined carrying capacity of 26 Bcf departed the U.S. between August 20 and August 26, 2020.
The number of rigs in operation dropped to 275 according to data from Enverus. Baker Hughes rig data shows natural gas specific rigs decreased by one from last week, down to 69.
Natural Gas Prices
Overall spot prices increased as above-average temperatures settled in across much of the country and hurricane Laura led to brief production interruptions. While the storm spared much of the Gulf’s energy infrastructure, over 60% of the region’s natural gas production was shut-in as evacuations reduced production by 2.7 Bcf/d. The brief interruption was partially offset as LNG demand dropped by 2.0 Bcf/d when LNG terminals were also taken offline.
Prompt month, 12-month, and seasonal strip prices continued their upward movement but appear limited to the near term as prices from Cal ’21 to Cal’ 23 drop off. However, it’s unclear if the backwardation is the result of anticipated supply issues or just typical late-season market sentiment, especially since storage is forecast to conclude injection season at a surplus to the five-year average.
PUCO Issues Winter Reconnect Order
As Ohio’s moratorium on utility shut-offs has expired, some are confronting service disconnections. The Public Utilities Commission of Ohio (PUCO) Winter Reconnect order may offer help.
According to a news release from PUCO, “The Public Utilities Commission of Ohio (PUCO) today issued its Winter Reconnect Order for the upcoming winter heating season. The Winter Reconnect Order helps Ohioans served by PUCO-regulated utilities reconnect or maintain electric and natural gas service during the winter heating season between Oct. 5, 2020 and April 15, 2021.”