.png)
Natural Gas – Week In Review
Natural gas report week, July 28, 2022.
This week’s injection of 15 Bcf (yes, you read that correctly) came in at the low end of analysts’ expectations which ranged from 11 Bcf to 28 Bcf. Comparatively, last year’s injection was 38 Bcf and the five-year average of net injections is 32 Bcf. Current storage totals 2,416 Bcf which is 12.5% below the five-year average but still marginally within the five-year historical range. This marks the second consecutive week the gap between the current storage total and the five-year average has grown.
Looking at market activity this week, it’s interesting to note that both the balance of the summer strip (September and October 2022) as well as the winter forward strip (November 2022 through March 2023) posted week-over-week gains exceeding 25.0 cents and CY23 added 6.1 cents from last week but the 12-month strip somehow lost 6.7 cents. Since the strips and CY23 all generally look at a portion of the same time frame, the standout is an interesting one. A closer look reveals week-over-week losses beginning in the second quarter of 2023, running through the end of the third quarter 2023. The only other losses this week were CY24, down 1.6 cents.
While it might be a little early to draw solid inferences from this, it looks an awful lot like market confidence that production will pick up next injection season. This also seems consistent with EIA projections that in 2023, dry natural gas production will increase by 3.7 Bcf/d (4%) to reach 100.0 Bcf/d.
Natural Gas Weekly Fundamentals
Demand- Total demand dropped by 0.3 Bcf/d from last week. LNG export ships increased by two, totaling 18 on the week for an overall capacity of 67 Bcf, up 6 Bcf from last week.
Production – Production remained sluggish over last week, picking up only 0.1 Bcf/d. The natural gas rig count grew by 2 from last week, totaling 155 rigs.
Storage Forecast – The average rate of injections into storage is 6% lower than the five-year average at this point in refill season (which traditionally runs April through October). If the injection rate matches the five-year average of 8.7 Bcf/d through October 31, natural gas supply will total 3,300 Bcf, 345 Bcf lower than the five-year average of 3,645 Bcf.
Natural Gas Market Report – July 28, 2022
September NYMEX
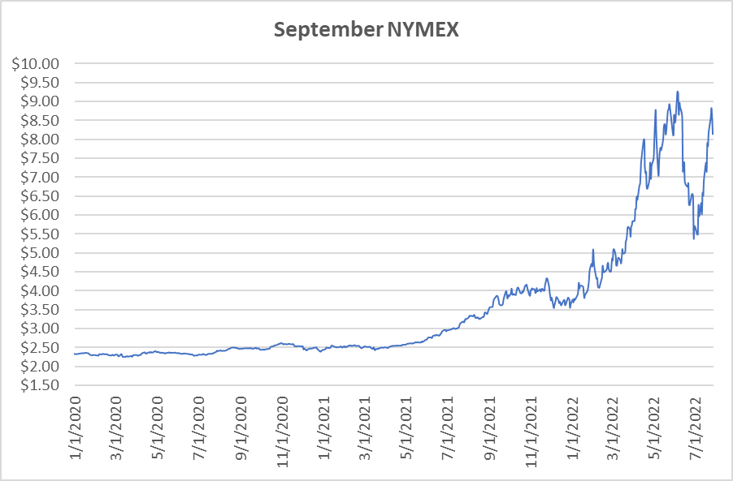
August moved off the board Wednesday, July 27th, settling the month at $8.687/Dth. September settled Thursday at $8.134/Dth down 42.0 cents from Wednesday’s close at $8.554/Dth, but up 31.9 cents from last week.
12 Month Strip
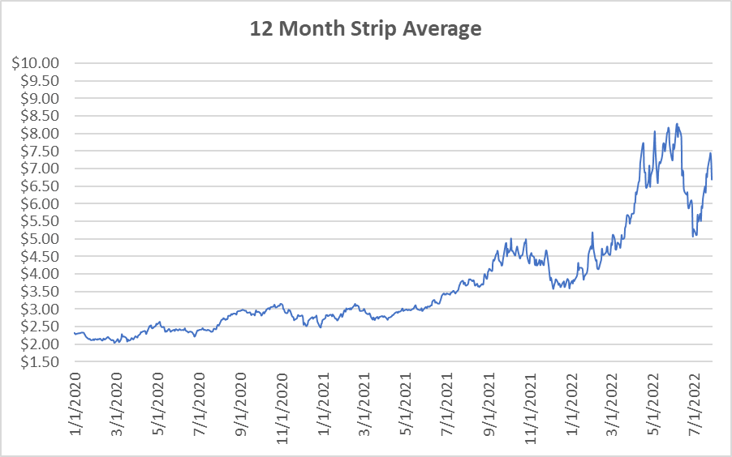
Settled Thursday at $6.688/Dth, down 6.7 cents from the prior week.
Seasonal Strips
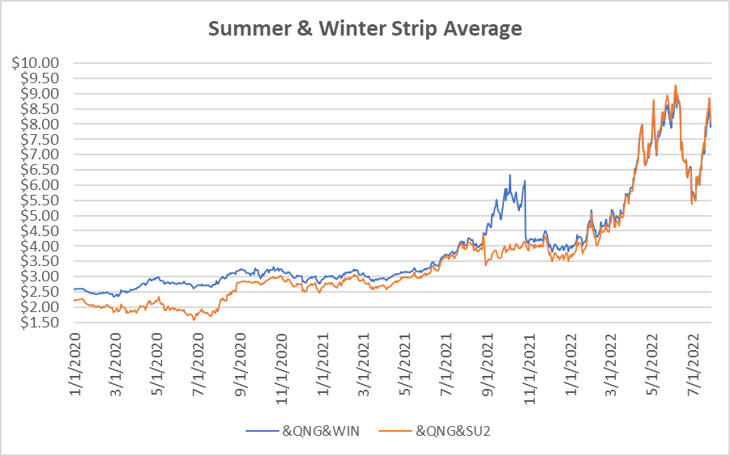
The balance of the summer strip settled at $8.126/Dth, up 28.2 cents from the week prior. The winter forward (NOV22-MAR23) settled Thursday at $7.895/Dth, up 31.3 cents from the week prior.
Calendar Years 2022/2023/2024
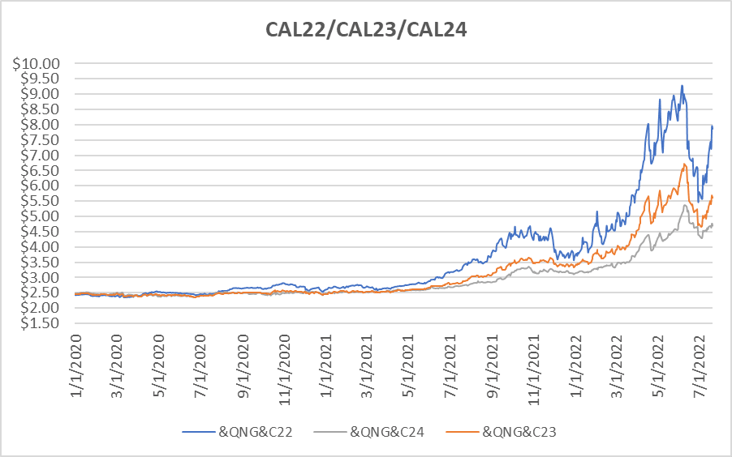
CY22 settled Thursday at $8.188/Dth, up 32.3 cents from the prior week.
CY23 settled Thursday at $5.656/Dth, up 6.1 cents from the prior week.
CY24 settled Thursday at $4.676/Dth, down 1.6 cents from the prior week.
Crude Oil
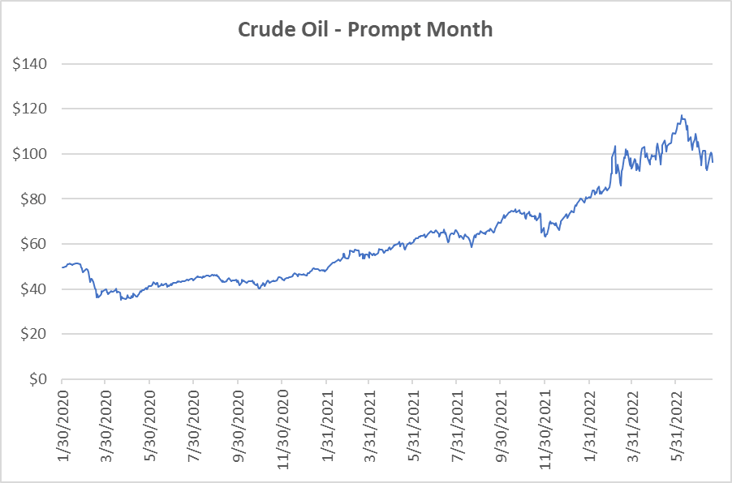
Settled Thursday at $96.42/barrel, up 7.0 cents from the prior week.
Need Help Making Sense of Natural Gas Prices?
We can help you manage risk and navigate the current price volatility. We’ll evaluate your current contract and explore your natural gas buying options.
Call us at 866-646-7322 for a no-cost, no-obligation analysis today.