
For natural gas report week May 6, 2021, the EIA reported a net increase in storage of 60 Bcf. The build was in line with forecasts ranging from injections of 50 Bcf to 76 Bcf, averaging 62 Bcf. Last year for the same week there was an injection of 103 Bcf and the five-year average is an injection of 81 Bcf.
Working gas in storage was 1,958 Bcf as of Friday, April 30, 2021 per EIA estimates. Inventory was 345 Bcf (-15.0%) less than last year for the same week and 61 Bcf (-3.0%) below the five-year average of 2,019 Bcf.
Natural Gas Market Recap
June NYMEX
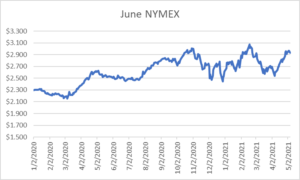
Settled Thursday at $2.928/Dth, down a penny from Wednesday’s close at $2.938/Dth.
12 Month Strip
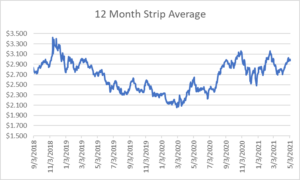
Settled Thursday at $2.973/Dth, up 1.8 cents from the prior week.
Seasonal Strips
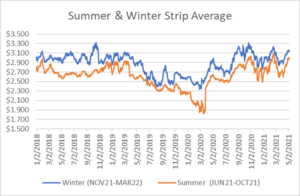
The summer strip (JUN21-OCT21) settled Thursday at $2.969/Dth, up 1.4 cents from the week prior. The winter strip (NOV21-MAR22) settled Thursday at $3.136/Dth, up 1.7 cents from the week prior.
Natural Gas Weekly
Natural Gas Report – May 6, 2021
Natural Gas Fundamentals
Overall supply averaged 96.1 Bcf/d last week as production remained flat. Meanwhile, imports from Canada fell for the second week in a row, down by 5.6%.
Total demand increased slightly by 0.4% from the prior report week, averaging 90.5 Bcf/d. Residential-commercial demand declined by 0.4% and consumption for power generation increased by 4.1%. Industrial demand fell by 3.3% while exports to Mexico dropped by 0.5%.
LNG pipeline receipts remained steady over the last week, averaging 11.2 Bcf/d. Twenty-two LNG vessels with a combined carrying capacity of 84 Bcf departed the U.S. between April 29 and May 5, 2021.
Baker Hughes rig data shows the overall number of rigs in operation increased by 2, up to 440. Natural gas specific rigs increased by two from last week, up to 96.
Natural Gas Prices
Spot prices were mixed throughout the country, partially in response to above-average temperatures in the west driving cooling related consumption and chilly weather in the east sustaining demand for heating. Pipeline maintenance and production increases likewise contributed to mixed spot price results. NYMEX activity was subdued across the report week, as the tension between production (which has been relatively flat) and demand (with LNG averaging 3.6 Bcf/d higher than last year at this time) casting doubt on end of injection season storage totals. As storage sits at a deficit, albeit small, to the five-year average, the market appears to be waiting for something to tip the balance. In the interim, absent a significant change, breaking the $3.000/Dth mark is unlikely.
Energy Efficiency Returns Big Results
The Times of Northwest Indiana published a story this week detailing the noteworthy success of an energy efficiency project at Sullivan-Palatek, an Indiana air compressor manufacturer. The company received a rebate of $46,000 on an LED Lighting project. Director of Plant Operations, Scott Newcomb stated, “…the decision to go ahead with the project was made after learning how quickly the savings would add up to a full return on the investment. The company expects the project to have paid for itself in 18 to 24 months.”
Not only do energy efficiency projects provide a favorable ROI, they’re also one of the most effective tools for reducing consumption which can help control costs. If upfront capital expense is a concern, financing is available. Learn more about our energy efficiency programs here.
Do you have the best natural gas contract for your business?
We can help you evaluate your current contract and explore your natural gas buying options. Call us at 866-646-7322 for a no-cost, no-obligation analysis today.