
For natural gas report week, May 7, 2020, the EIA reported, the EIA reported a net increase in storage of 109 Bcf, in line with forecasts of injections ranging from 90 Bcf to 112 Bcf and averaging 106 Bcf. Last year for the same week there was an injection of 96 Bcf and the five-year average is an injection of 74 Bcf.
Working gas in storage was 2,319 Bcf as of Friday, May 1st, 2020 per EIA estimates. Inventory was reported at 796 Bcf (52.3%) higher than last year for the same week and 395 Bcf (20.5%) more than the five-year average of 1,924 Bcf.
June NYMEX
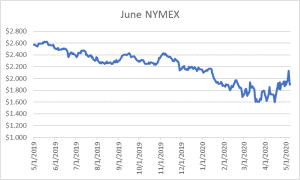
Settled Thursday at $1.894/Dth down 5.0 cents from Wednesday’s close at $1.944/Dth.
12 Month Strip
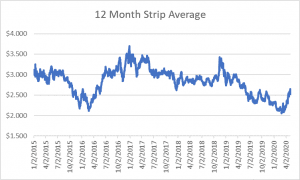
Settled Thursday at $2.521/Dth, down 7.1 cents from the prior week.
Seasonal Strips
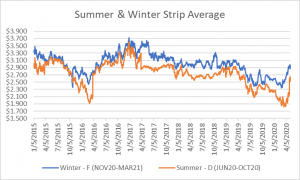
The summer strip (JUN20-OCT20) settled Thursday at $2.521/Dth, up 29.1 cents from the week prior. The winter strip (NOV20-MAR21) settled at $2.868/Dth, down 8.4 cents from last week.
Natural Gas Weekly
Natural Gas Report – May 7, 2020
Natural Gas Fundamentals
Overall supply averaged 95.4 Bcf/d last week as imports from Canada decreased by 4.6% and production declined by 1.3%. The decline is largely due to a supply drop in the Appalachia Basin following Tuesday’s Enbridge pipeline explosion on its TETCO system Tuesday. The event reportedly impacts more than 1.3 Bcf north-to-south capacity. Production fell immediately following the explosion but began to recover by the following day as transport was rerouted. This follows an NGPL force majeure at the Sabine Pass liquefaction facility in Louisiana the prior week.
Total demand fell by 15.3% from the prior report week. Notably, residential-commercial consumption declined by 38.2%, dropping from 20.9 Bcf/d to 13.0 Bcf/d week-over-week. Industrial demand fell 11.8% from last week and exports to Mexico decreased by 5.3%. Natural gas used for power generation increased by 0.5%. LNG exports increased from last week, up 4 LNG vessels to 15 with a combined carrying capacity of 54 Bcf.
According to data from Enverus, the daily rig count fell by 32 from last week, down 7.0% to 383.
Natural Gas Prices
Following Tuesday’s pipeline explosion, prompt month prices traded up to $2.134/Dth as calendar and seasonal strips generally rose in the days leading up to the release of the EIA storage report. However, demand decimation contributed to the season’s first triple digit injection and the supply-demand imbalance led to lower prices in all but the diminishing summer strip.
The future of oil prices will ultimately have substantial impact of the direction of natural gas prices. The brief price rally came to an end, even after the week’s build came in at 4.6 mb – substantially below analysts’ expectations of 8.99 mb. According to Fox Business, “Demand for crude oil has fallen by 30 million barrels per day as “stay-at-home” orders from governments all over the world have brought non-essential travel to a crawl. At the same time, the world’s largest oil producers have begun cutting production by 20 million barrels per day on May 1.”
Cuts in oil production translate to less associated natural gas production. As most states unwind their stay-at-home orders and people return to work, demand will begin to normalize which will provide a clearer price picture. Should oil prices remain low, it’s likely natural gas prices will begin to rise.