Natural gas report week, October 28, 2021 brought more of the same as continued shifting price momentum threatened to leave market observers with whiplash. Since the beginning of September, prompt month, 12-month and seasonal strips have consistently posted gains one week, only to retreat the next. Is it as simple as shoulder season weather fundamentals keeping the pendulum in motion, or is there something more at work?
Should we expect more of the same throughout winter or is it possible the answer is also just as difficult to pin down? Let’s take a look…
Clear As Mud?
As far as the typical supply/demand fundamentals, things don’t look too bad this week. Here’s a quick snapshot of the basics:
- Storage injection of 87 Bcf, which exceeds both last year’s injection of 32 Bcf and the five-year average of 62 Bcf.
- Near elimination of the gap between end-of-season (by the calendar, October 31st) storage totals and the five-year average. Presently that shortfall is just 126 Bcf which is 50 Bcf above the EIA projection at the midpoint of injection season (July16).
- Production up 1.4 Bcf/d from last week and 4.3 Bcf/d over last year at this time.
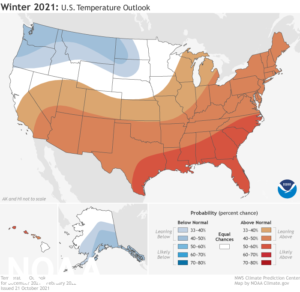
- Despite chilly weather limited to the next ten days, NOAA’s winter forecast suggests above-average temperatures for much of the country which would translate to moderate heating demand.
Clarity On The Horizon?
As the winter outlook becomes clearer, expectations for historically high winter natural gas prices seem more difficult to understand. This much is evident even in expert analysis. From sentiment that high prices will be limited to just this winter to projections for a recurring energy crisis, opinions have been as varied as recent winter strip prices. Rooted in the thought that international natural gas storage shortages will continue to drive overseas and domestic prices alike, the question seems to be, “For how long?” A CNBC report from this week tries to provide an answer. Some surveyed analysts expect high prices just through this winter while others paint a far more foreboding picture. (Is anyone really surprised?) Is it possible the answer is somewhere in the middle?
That seems to be the case as this week Russia solidified their commitment to delivering additional natural gas supply to ease near-empty European storage, reversing the recent historic price movement. “Dutch gas futures fell 8.9% to €79.10 ($92.35) a megawatt-hour on Thursday. The move put prices on track to fall by almost a fifth in October, an unseasonal decline and the biggest monthly drop since February. U.K. futures lost more than 11%. U.S. natural-gas prices fell, too, though less than the two European benchmarks.”
Nonetheless, skeptics remain…well…skeptical of whether or not Russia will actually deliver. Is the apprehension well-founded? We’ll see.
JAN22, settled at $5.871/Dth, up 41.0 cents
FEB22, settled at $5.760/Dth, up 38.5 cents
MAR22, settled at $5.418/Dth up 32.3 cents
APR22, settled at $4.149/Dth up 12.2 cents
MAY22, settled at $4.037/Dth up 11.1 cents
JUN22, settled at $4.068/Dth up 10.5 cents
Natural Gas Market Report – October 28, 2021
December NYMEX
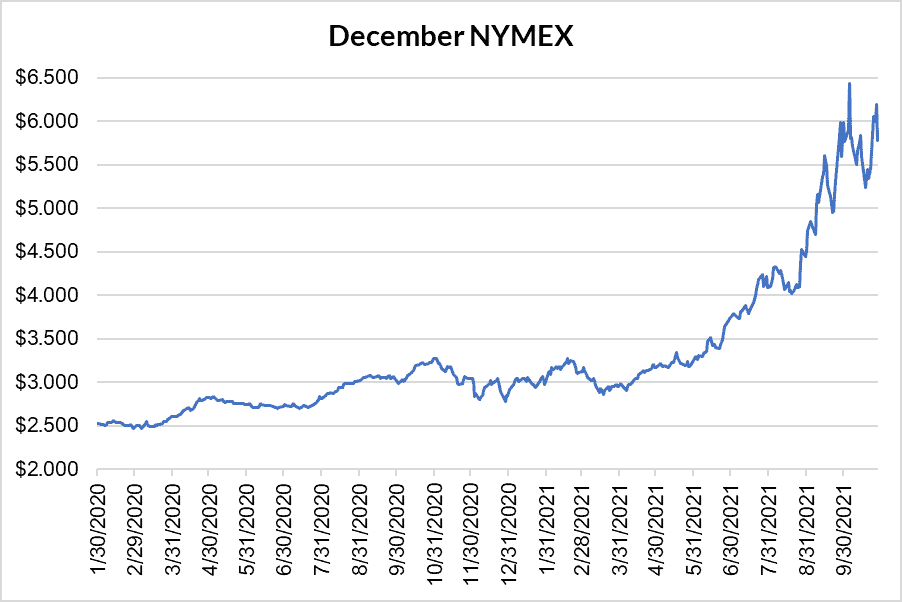
December settled Thursday at $5.782/Dth down 41.6 cents from Wednesday’s close at $6.198/Dth, but up 43.6 cents week over week.
November moved off the board Wednesday, October 27th, settling the month at $6.202/Dth.
12 Month Strip
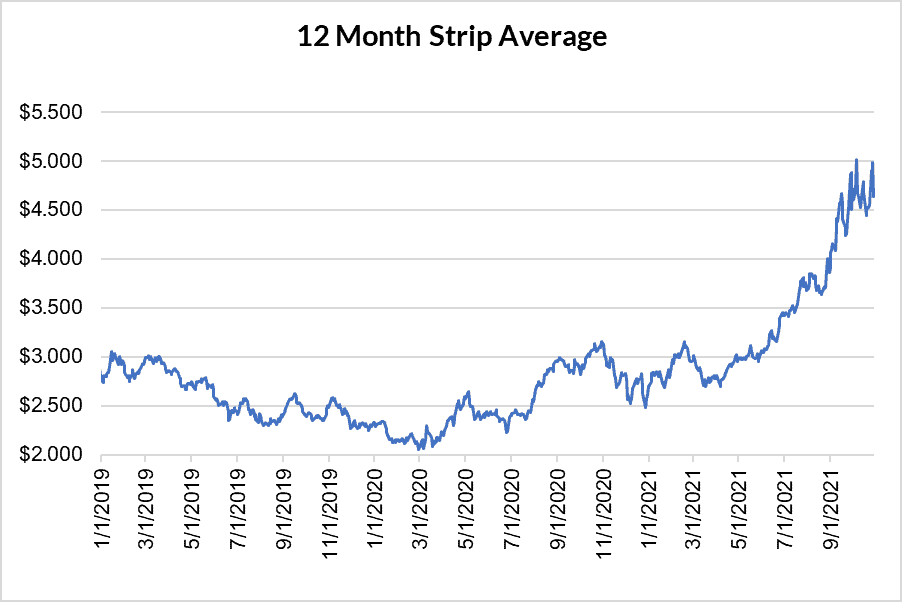
Settled Thursday at $4.643/Dth, up 11.5 cents from the prior week.
Seasonal Strips
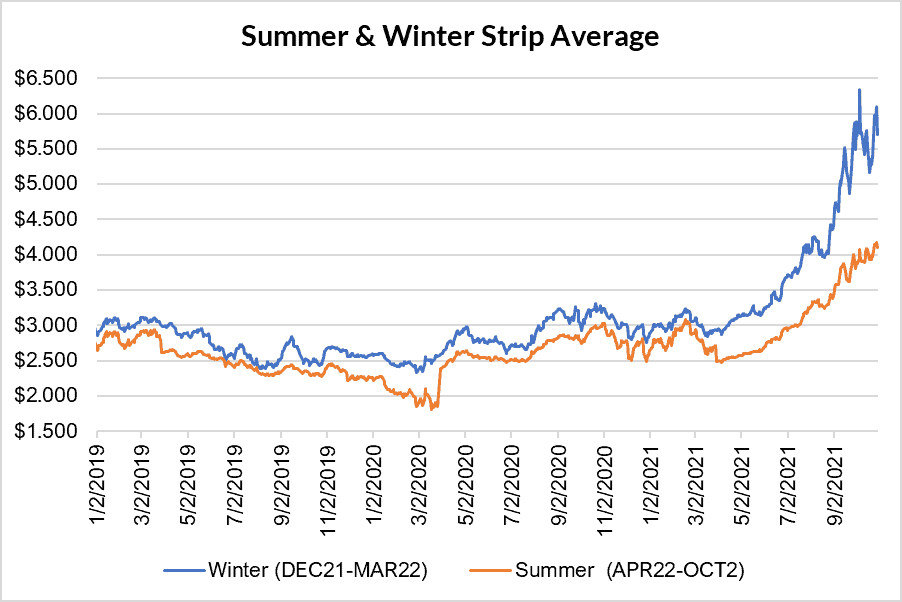
The winter strip (DEC21-MAR22) settled Thursday at $5.708/Dth, up 43.0 cents from the week prior. The summer strip (APR22-OCT22) settled Thursday at $4.097/Dth, up 10.6 cents from the week prior.
Calendar Years 2022/2023/2024
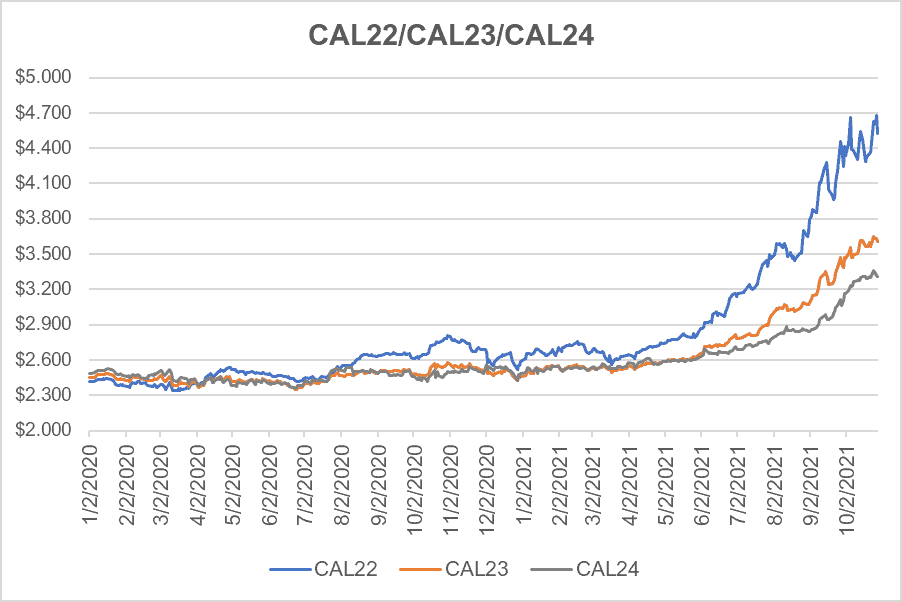
CY22 settled Thursday at $4.525/Dth, up 17.0 cents from the prior week.
CY23 settled Thursday at $3.607/Dth, up 1.1 cents from the prior week.
CY24 settled Thursday at $3.307/Dth, unchanged week over week.