.png)
Natural Gas – Week In Review
Natural gas report week, August 11, 2022.
This week’s injection of 44 Bcf was in line with analysts’ expectations which ranged from 30 Bcf to 47 Bcf. Comparatively, last year’s injection was 44 Bcf and the five-year average of net injections is 45 Bcf. Current storage totals 2,501 Bcf which is 11.9% below the five-year average but within the five-year historical range.
Overall, prices reversed course from the last two weeks of declines as recent news surrounding the Freeport LNG plant prompted rumors the facility’s 2.0 Bcf/d of demand might be restored sooner than initially projected. While Freeport officials dismissed the claims, it did little to settle prices.
Natural Gas Weekly Fundamentals
Demand
Total demand increased by 1.8 Bcf/d from last week, led once again by growth in consumption for power generation. LNG export ships dropped by by five, totaling 17 on the week for an overall capacity of 64 Bcf, down 17 Bcf from last week.
Production
Production grew minimally, adding 0.2 Bcf/d. The natural gas rig count grew by 4 from last week, totaling 161 rigs. Oil-directed rigs decreased by 7 to 598 rigs.
Storage Forecast
The average rate of injections into storage is 5% lower than the five-year average at this point in refill season (which traditionally runs April through October). If the injection rate matches the five-year average of 9.3 Bcf/d through October 31, natural gas supply will total 3,307 Bcf, 338 Bcf lower than the five-year average of 3,645 Bcf.
Natural Gas Price News
Last week the EIA reported that, “Natural gas price volatility reached an all-time high in first-quarter 2022. Natural gas price volatility—a measure of how much daily prices change—reached the highest levels in 20 years in the first quarter of 2022 in the United States. The 30-day historical volatility of U.S. natural gas prices, based on the Henry Hub front-month futures price, averaged 179% in February compared with the five-year (2017–21) average of 48%.”
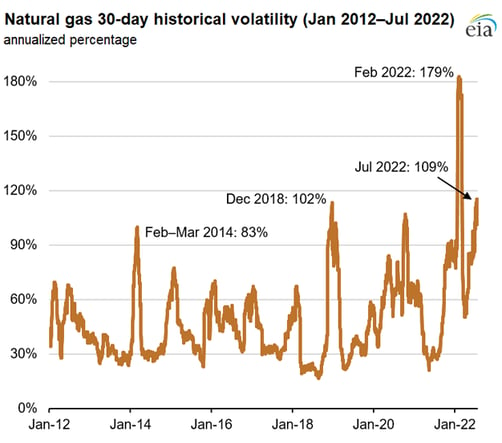
It’s one thing to write about prices in analytical terms, but practically, volatility can be extremely difficult for businesses to manage – especially when it’s compounded by increased costs for the materials and services a business relies on to operate.
The longer price volatility continues, the less “riding it out” seems possible. While it may appear easier than trying to sort it all out, the impact is costly.
Even as energy prices are at historic highs and businesses have identified the costs as a source of worry, shopping for energy is too often set aside. Easier paths like just sticking with the utility or not shopping supply options are silent budget killers, amounting to unnecessarily high costs largely dismissed as just the cost of doing business.
But it doesn’t have to be that way.
To learn how you can minimize the impact of energy price volatility on your business, please check out our resource, Ways to Protect Your Business From Rising Energy Costs or give us a call at 866-646-7322 and one of our energy managers will answer your questions.
Natural Gas Weekly Market Report - August 11, 2022
September NYMEX
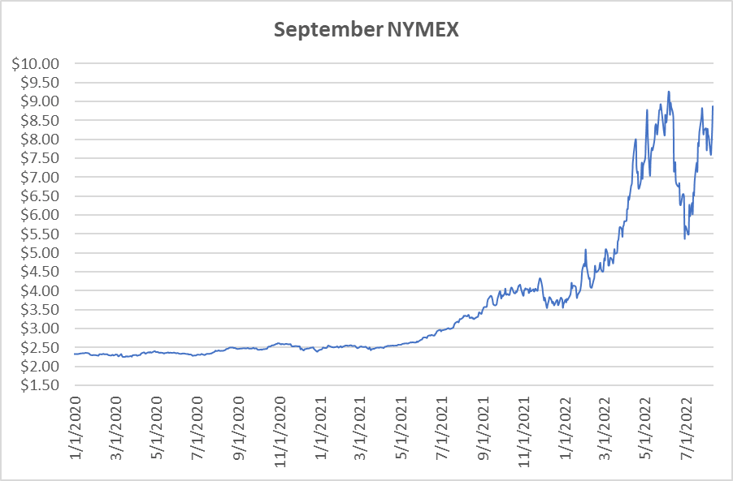
September settled Thursday at $8.874/Dth up 67.2 cents from Wednesday’s close at $8.202/Dth and up 75.2 cents from last week.
12 Month Strip
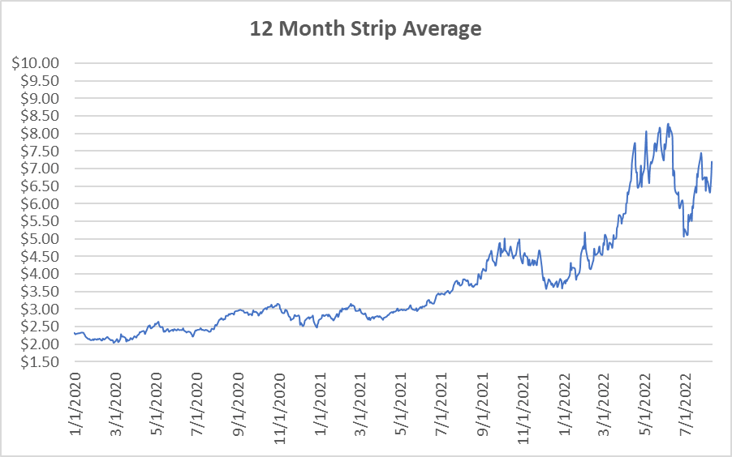
Settled Thursday at $7.197/Dth, up 54.0 cents from the prior week.
Seasonal Strips
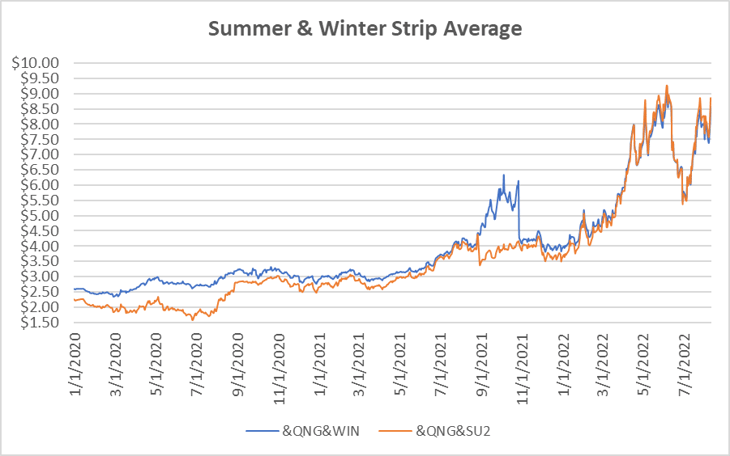
The balance of the summer strip settled at $8.869/Dth, up 75.1 cents from the prior week. The winter forward (NOV22-MAR23) settled Thursday at $8.558/Dth, up 69.0 cents from last week.
Calendar Years 2022/2023/2024
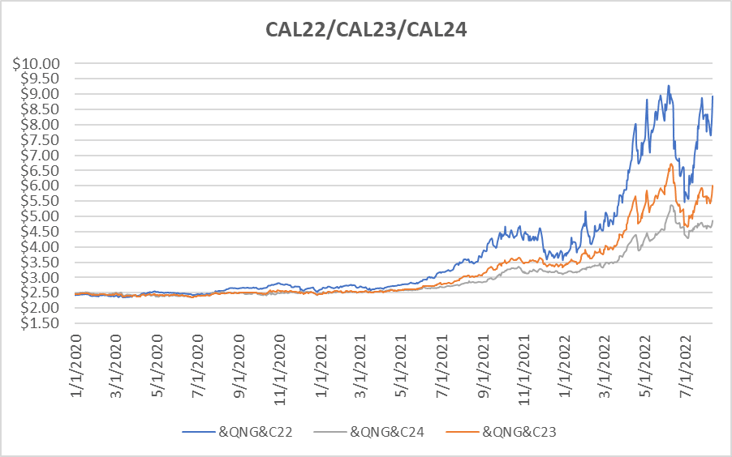
CY22 settled Thursday at $8.932/Dth, up 75.6 cents from the prior week.
CY23 settled Thursday at $6.003/Dth, up 39.0 cents from the prior week.
CY24 settled Thursday at $4.856/Dth, up 18.7 cents from the prior week.
Crude Oil
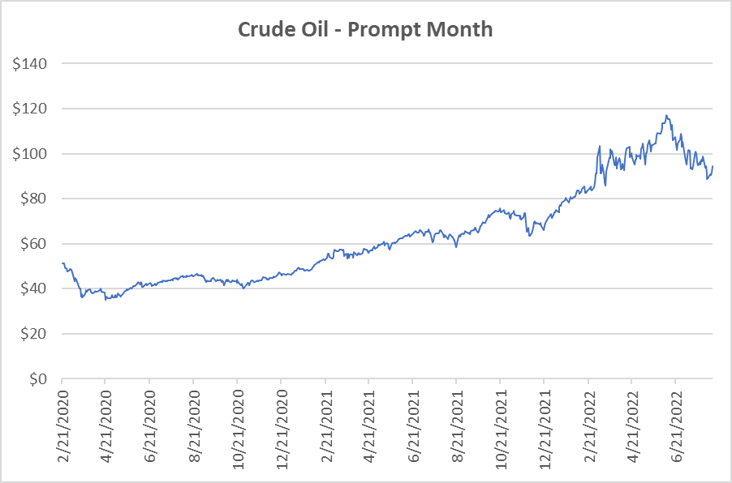
Settled Thursday at $94.34/barrel, up $5.80 from the prior week.
Need Help Making Sense of Natural Gas Prices?
We can help you manage risk and navigate the current price volatility. We’ll evaluate your current contract and explore your natural gas buying options.
Call us at 866-646-7322 for a no-cost, no-obligation analysis today.