.png)
Natural Gas – Week In Review
Natural gas report week, August 18, 2022.
This week’s injection of 18 Bcf was at the low end of analysts’ expectations which ranged from 14 Bcf to 43 Bcf. Comparatively, last year’s injection was 46 Bcf and the five-year average of net injections is 47 Bcf. Current storage totals 2,519 Bcf which is 12.7% below the five-year average but still marginally within the five-year historical range.
With prices trending higher, we’ll take a look at fundamentals, what’s behind the price movement, and how to understand what this may mean for winter prices.
Natural Gas Weekly Fundamentals
Demand
Total demand fell by 6.0 Bcf/d from last week, due in large part to cooler temperatures which translated to a 5.4 Bcf/d drop in natural gas consumption for power generation. LNG export ships increased by two, totaling 19 on the week for an overall capacity of 70 Bcf, up 6 Bcf from last week.
Production
Production declined by 1.8 Bcf/d from last week. The natural gas rig count lost one over last week, totaling 160 rigs. Oil-directed rigs added three, now up to 601 rigs.
Storage Forecast
The average rate of injections into storage is 7% lower than the five-year average at this point in refill season (which traditionally runs April through October). If the injection rate matches the five-year average of 9.5 Bcf/d through October 31, natural gas supply will total 3,278 Bcf, 367 Bcf lower than the five-year average of 3,645 Bcf.
Making Sense of Natural Gas Prices
Over the last week, natural gas prompt month prices flirted with the $10-mark. Even with milder weather subduing demand, slumping production led to an anemic injection and a widening in the gap between the storage total and the five-year average. Were this an occurrence limited to a couple of weeks during injection season, the impact on prices would be likewise limited. That’s not what’s happening though. Perhaps the easiest way to explain it is through the following image from the EIA:
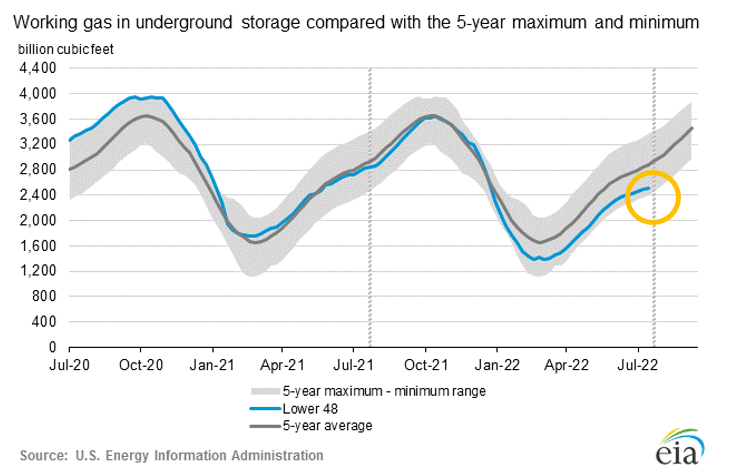
What you’re seeing here is a graph of storage totals over time (blue line), compared to the five-year average (solid grey line), and the five-year minimum-maximum range. You can tell, roughly, that total storage is below what is typical compared to the last couple of years and it’s also well below the five-year average. Clearly this injection season is different. Unlike 2020 and 2021, the gap between then-current storage totals and the five-year average has remained significant. That was a matter for small concern at the beginning of injection season (April) when we had the benefit of a full summer in front of us. Usually, it gives us time to rebuild storage.
But that hasn’t happened. And with each storage report, the week’s reported injection total has brought us closer to falling outside the minimum of the five-year range (see orange circle). With little more than two months left of injection season, that’s not a favorable outlook if you are waiting on lower prices. At this point, it would require a significant change in production pace and the obliteration of demand to turn things around.
So, as long as this graph looks like this, the closer we get to the end of injection season, expect more of the same from prices. Additionally, extreme heat and adverse weather events (namely hurricanes) will act as amplifiers, driving prices higher.
This underscores the need to have a plan to manage winter price volatility. If you don’t have something in place, please protect your business financially. Give us a call. 866-646-7322.
Natural Gas Weekly Market Report - August 18, 2022
September NYMEX
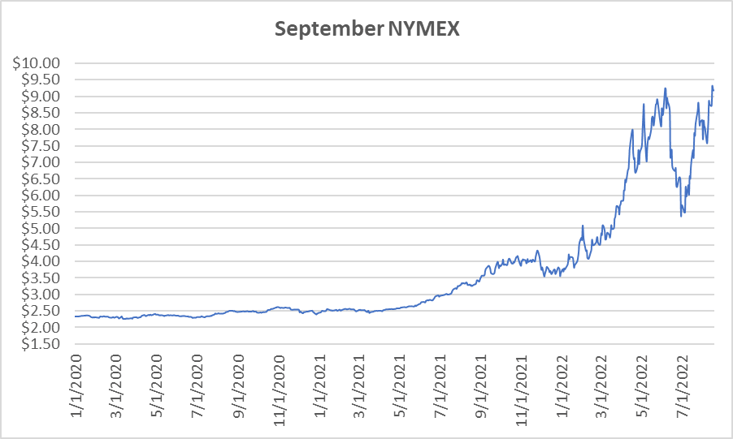
September settled Thursday at $9.188/Dth down 5.6 cents from Wednesday’s close at $9.244/Dth but up 31.4 cents from last week.
12 Month Strip
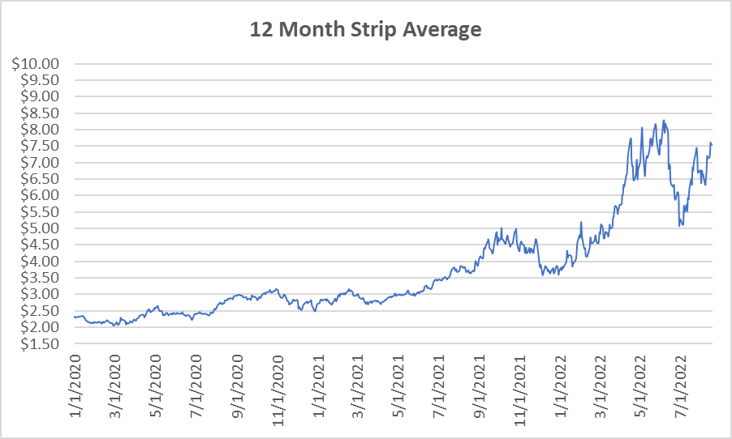
Settled Thursday at $7.545/Dth, up 34.8 cents from the prior week.
Seasonal Strips
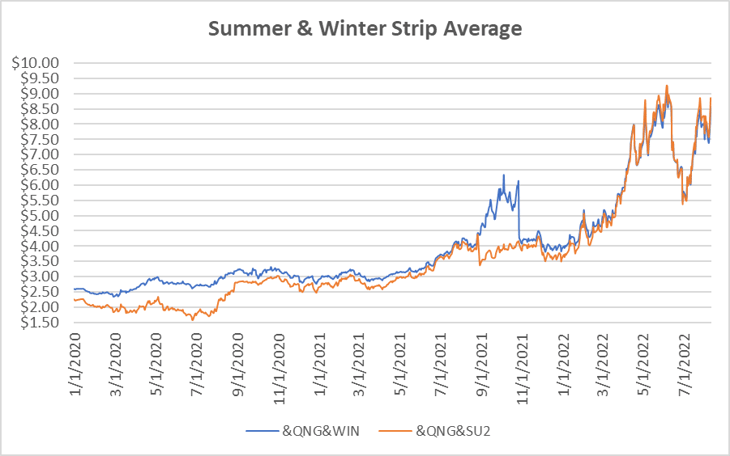
The balance of the summer strip settled at $9.179/Dth, up 31.0 cents from the prior week. The winter forward (NOV22-MAR23) settled Thursday at $8.870/Dth, up 31.2 cents from last week.
Calendar Years 2022/2023/2024
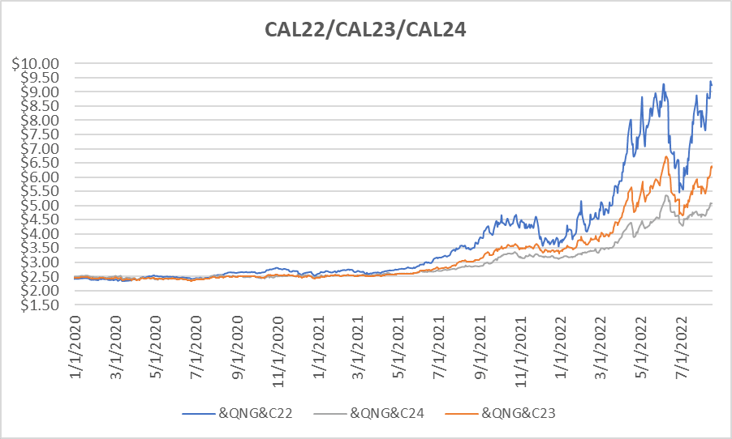
CY22 settled Thursday at $9.238/Dth, up 30.6 cents from the prior week.
CY23 settled Thursday at $6.379/Dth, up 37.6 cents from the prior week.
CY24 settled Thursday at $5.080/Dth, up 22.4 cents from the prior week.
Crude Oil
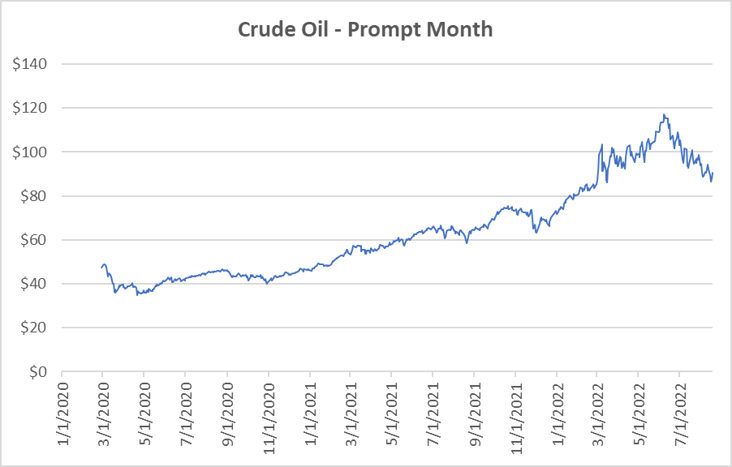
Settled Thursday at $90.50/barrel, down $3.84 from the prior week.
Need Help Making Sense of Natural Gas Prices?
We can help you manage risk and navigate the current price volatility. We’ll evaluate your current contract and explore your natural gas buying options.
Call us at 866-646-7322 for a no-cost, no-obligation analysis today.