Natural Gas Storage Summary
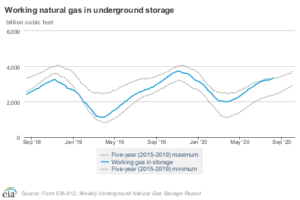
For natural gas report week, August 13, 2020, the EIA reported a net increase in storage of 58 Bcf. The build was in line with forecasts of injections ranging from 42 Bcf to 65 Bcf, averaging 56 Bcf. Last year for the same week there was an injection of 51 Bcf and the five-year average is 44 Bcf.
Working gas in storage was 3,332 Bcf as of Friday, August 7th, 2020 per EIA estimates. Inventory was 608 Bcf (22.3%) higher than last year for the same week and 443 Bcf (15.3%) more than the five-year average of 2,889 Bcf.
Natural Gas Market Recap
September NYMEX
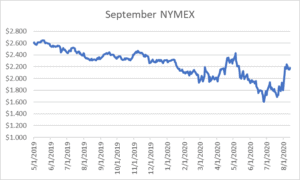
September settled Thursday at $2.182/Dth up 3.0 cents from Wednesday’s close at $2.152/Dth.
12 Month Strip

Settled Thursday at $2.734/Dth, up 2.4 cents from the prior week.
Seasonal Strips
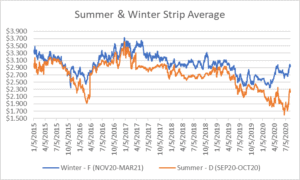
The summer strip (SEP20-OCT20) settled Thursday at $2.253/Dth, up 1.8 cents from the week prior. The winter strip (NOV20-MAR21) settled at $2.972/Dth, up 2.7 cents from last week.
Natural Gas Weekly
Natural Gas Report – August 13, 2020
Natural Gas Fundamentals
Overall supply averaged 94.7 Bcf/d last week with production growing by 1.2%. Meanwhile, imports from Canada grew by 2.6%.
The average rate of injections into storage is 11% more than that of the five-year average for this point in the refill season. If the injection rate matched the five-year average of 9.8 Bcf/d through the end of refill season (October 31st), withdrawal season would begin with 4,166 Bcf in storage, which is 443 Bcf higher than the five-year average of 3,723 Bcf.
Total demand grew by 0.5% from the prior report week, averaging 86.2 Bcf/d. Power generation and residential-commercial consumption increased by 0.9% and 1.9%, respectively. Industrial demand decreased by 0.7% and exports to Mexico fell by 1.7%.
LNG pipeline receipts are up 14% (by 0.6 Bcf/d). Eight LNG vessels with a combined carrying capacity of 29 Bcf departed the U.S. between August 6 and August 12, 2020.
The number of rigs in operation remained steady at 280 according to data from Enverus. Baker Hughes rig data shows natural gas specific rigs remained flat at 69 from last week.
EIA Crude Oil Forecasts
In the August 2020 Short Term Energy Outlook, the EIA forecasts high inventory levels with excess crude oil production will subdue short-term prices. However as low crude prices lead to decreased drilling and inventories decline amid stabilizing demand through 2021, prices are expected to eventually increase. In fact, EIA expects monthly Brent spot prices will average $43/b during the second half of 2020, rising to an average of $50/b in 2021. The low prices will reduce associated natural gas output from oil-directed rigs.
Given EIA estimates, the following fundamentals are at play in the crude oil market roller coaster:
Supply
- For the first half of 2020, supply grew at a rate of 6.4 mb/d.
- During the second half of 2020, inventory is projected to decline at a rate of 4.2 mb/d.
- In 2021, supply is expected to fall at a rate of 0.8 mb/d.
Production
Newly released EIA data indicates U.S. average monthly crude production for May 2020 was 1.2 mb/d below reported estimates in the July 2020 Short Term Energy Outlook, evidencing deeper production cuts than previously estimated.
- 2019 – crude production averaged 12.2 mb/d.
- 2020 – production is slated to average 11.3 mb/d.
- 2021 – production forecast is 11.1 mb/d.
Demand
COVID-19 travel restrictions and stay-at-home orders contributed to a 20% drop in crude consumption in the 2Q 2020 compared to the same period the year before. In 2Q 2019, U.S. consumption averaged 20.3 mb/d compared to 16.2 mb/d in 2Q 2020. The EIA anticipates overall crude demand will increase through the end of 2021.
- 2019 – crude demand averaged 20.4 mb/d
- 2020 – EIA estimates demand will average 18.4 mb/d.
- 2021 – EIA forecasts demand will average 20.0 mb/d.
EIA Natural Gas Forecasts
The EIA anticipates prices will increase through the end of 2021 with the sharpest increases expected for fall and winter 2020-2021 as the result of rising demand and declining production. According to EIA market analysis, prices will rise from an average of $2.11/Dth in September to $3.14/Dth in February. Additionally, Henry Hub spot prices will average $2.03/Dth in 2020 and $3.14/Dth in 2021
Supply
- In 2019, natural gas inventories concluded injection season at 3,724 Bcf.
- Current projections put storage at 4,166 Bcf at the close of 2020 injection season.
Production
It is important to note that market forecasts still predict low crude oil prices (as mentioned above) which will lead to reduced crude drilling. The decline in oil rig output will translate to lower associated natural gas production which represents up to 30% of natural gas supply, particularly in the Permian region.
- 2019 – production averaged 92.2 Bcf/d.
- 2020 – production is expected to average 88.7 Bcf/d.
- 2021 – production is forecast to average 84.0 Bcf/d.
Production is anticipated to rise in 2Q 2021 in response to rebounding crude oil and natural gas prices.
Demand
- 2019 – overall consumption averaged 84.97 Bcf/d.
- 2020 – demand will drop 3% to an average of 82.4 Bcf/d.
- 2021 – consumption is projected to average 78.71 Bcf/d.