
For natural gas report week, August 6, 2020, the EIA reported a net increase in storage of 33 Bcf. The build was in line with forecasts of injections ranging from 23 Bcf to 35 Bcf, averaging 30 Bcf. Last year for the same week there was an injection of 58 Bcf and the five-year average is 33 Bcf.
Working gas in storage was 3,274 Bcf as of Friday, July 31st, 2020 per EIA estimates. Inventory was reported at 601 Bcf (22.5%) higher than last year for the same week and 429 Bcf (15.1%) more than the five-year average of 2,845 Bcf.
Natural Gas Market Recap
September NYMEX
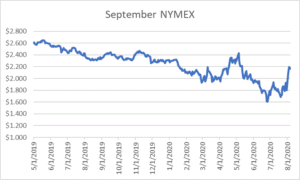
September settled Thursday at $2.165/Dth down 2.6 cents from Wednesday’s close at $2.191/Dth.
12 Month Strip
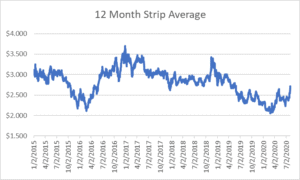
Settled Thursday at $2.710/Dth, up 15.0 cents from the prior week.
Seasonal Strips

The summer strip (SEP20-OCT20) settled Thursday at $2.235/Dth, up 32.5 cents from the week prior. The winter strip (NOV20-MAR21) settled at $2.945/Dth, up 15.4 cents from last week.
Natural Gas Weekly
Natural Gas Report – August 6, 2020
Natural Gas Fundamentals
Overall supply averaged 93.5 Bcf/d last week with production falling slightly by 0.7%. Meanwhile, imports from Canada grew by 10.0%.
The average rate of injections into storage is 10% more than that of the five-year average for this point in the refill season. If the injection rate matched the five-year average of 9.5 Bcf/d through the end of refill season (October 31st), withdrawal season would begin with 4,152 Bcf in storage, which is 429 Bcf higher than the five-year average of 3,723 Bcf.
Total demand fell by 6.2% from the prior report week, averaging 85.3 Bcf/d. Power generation and residential-commercial consumption declined by 9.3% and 8.8%, respectively. Industrial demand increased by 1.8% and exports to Mexico grew by 1.1%.
LNG pipeline receipts are up by 0.6 Bcf/d. Five LNG vessels with a combined carrying capacity of 18 Bcf departed the U.S. between July 30 and August 5, 2020.
The number of rigs in operation decreased by 3 to 280 according to data from Enverus. Baker Hughes rig data shows natural gas specific rigs are up by one to 69.
Natural Gas Prices
Spot prices were mixed, largely following the weather, up where temperatures were above normal and down in areas of cooler weather. Henry Hub spot prices were up 43.0 cents from a low of $1.75/Dth Wednesday, July 29th to a high of $2.18/Dth this past Wednesday.
Prompt month prices spiked 33.6 cents from the prior Thursday’s close on forecasts of above-average temperatures for key demand areas through the end of August. For most of the report week, prompt month, calendar and seasonal strips traded at highs last seen in February before falling from Wednesday to Thursday. Some analysts suggest the bullish price movement was the result of warm weather forecasts, predictions for restored LNG demand, and anemic production. Nonetheless, they caution, EIA estimates for end-of-season storage totals still at a healthy surplus to the five-year average may keep prices subdued until winter demand forecasts become more defined.
Natural Gas And Power Generation
Coal, natural gas, solar thermal energy and nuclear energy are all used to generate power for electricity generation. Natural gas used in electricity generation powers steam turbines. Heated water produces steam that turns a turbine to generate electricity. Most of the largest electric power plants in the United States have steam turbines.
With an increasing emphasis on emission reduction and given low natural gas prices, coal’s share of electricity generation is expected to decline from 24% in 2019 to 18% in 2020. While coal is expected to reclaim 3% of that share in 2021 as the result of higher natural gas prices, power generators have been making infrastructure changes leading to long-term deference to natural gas. “According to data from the U.S. Energy Information Administration (EIA), 121 U.S. coal-fired power plants were repurposed to burn other types of fuels between 2011 and 2019, 103 of which were converted to or replaced by natural gas-fired plants. At the end of 2010, 316.8 gigawatts (GW) of coal-fired capacity existed in the United States, but by the end of 2019, 49.2 GW of that amount was retired…”
As such, when July temperatures soared, so did demand for power used in cooling. This led to record setting demand for natural gas used in power generation. The EIA reported, “Natural gas consumed by electric power plants (power burn) set a record high of 46.7 billion cubic feet (Bcf) on Monday, July 27, according to S&P Global Platts estimates. On the same day, natural gas-fired capacity reached an all-time high dispatch level, reaching 315,989 megawatts (MW) in the late afternoon, according to EIA’s Hourly Electric Grid Monitor. Since July 1, 2020, U.S. power burn has exceeded the previous record of 45.4 Bcf/d―set on August 6, 2019―on six days: July 9, July 20–21, and July 27–29.