Natural gas report week, January 13, 2022 saw prices jump following a week of increased consumption driven by winter temperatures. Prices continued their climb on Wednesday immediately after the EIA’s report of a 179 Bcf withdrawal from storage, however that trend reversed course from Wednesday to Thursday despite forecasts for continued cold.
Natural Gas Outlook
Weary of winter temperatures and volatile natural gas prices? Not to worry according to forecasts from the EIA and NOAA, things are looking up for 2022.
Although January is expected to close with seasonably chilly weather, NOAA’s Climate Prediction Center anticipates above-average temperatures throughout 2022. This projection is consistent with EIA expectations for minimal growth in natural gas consumption for the year.
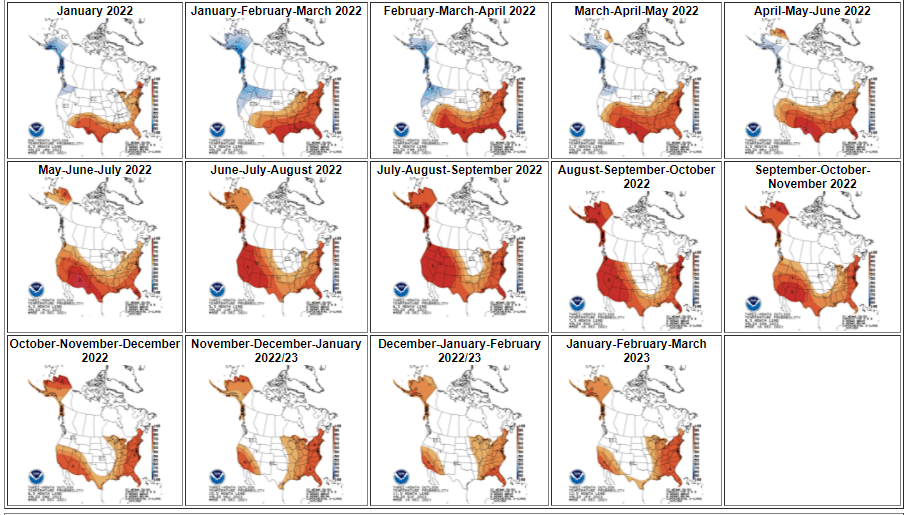
It also explains why despite substantial week-over-week natural gas price increases and forecasts for continued cold, market sentiment turned bearish. It seems focus has shifted to thinking spring.
To that end, presently, the average rate of withdrawal from storage is 23% below the five-year average. If that rate keeps pace with the five-year average of 15.4 Bcf/d until the end of withdrawal season on March 31, total inventory will be 1,738 Bcf, which is 72 Bcf higher than the five-year average of 1,666 Bcf.
With that, the EIA anticipates average annual prices will decline gradually through 2023 as production gains outpace demand, dropping from an average of $3.79/Dth in 2022 to an average of $3.63/Dth in 2023.
MAR22, settled at $4.005/Dth up 33.5 cents
APR22, settled at $3.938/Dth up 31.1 cents
MAY22, settled at $3.958/Dth up 31.3 cents
JUN22, settled at $4.011/Dth up 31.5 cents
Natural Gas Market Report – January 13, 2022
February NYMEX
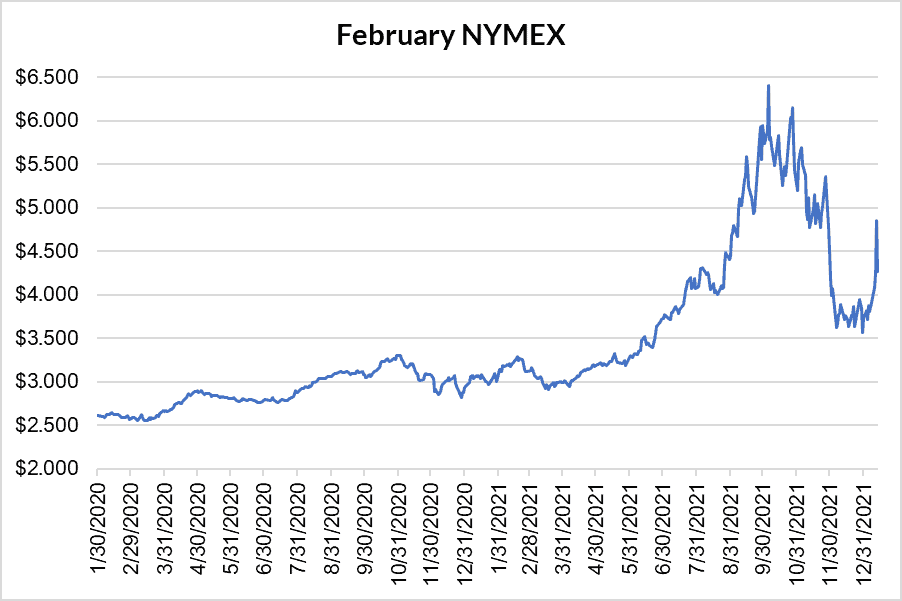
February settled Thursday at $4.270/Dth down 58.7 cents from Wednesday’s close at $4.857/Dth, but up 45.8 cents week-over-week.
12 Month Strip
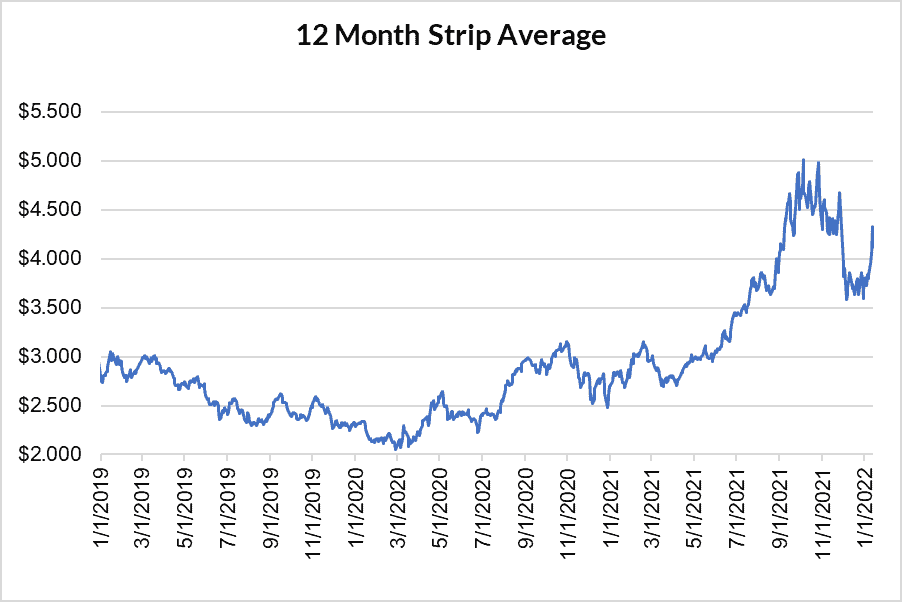
Settled Thursday at $4.119/Dth, up 31.9 cents from the prior week.
Seasonal Strips
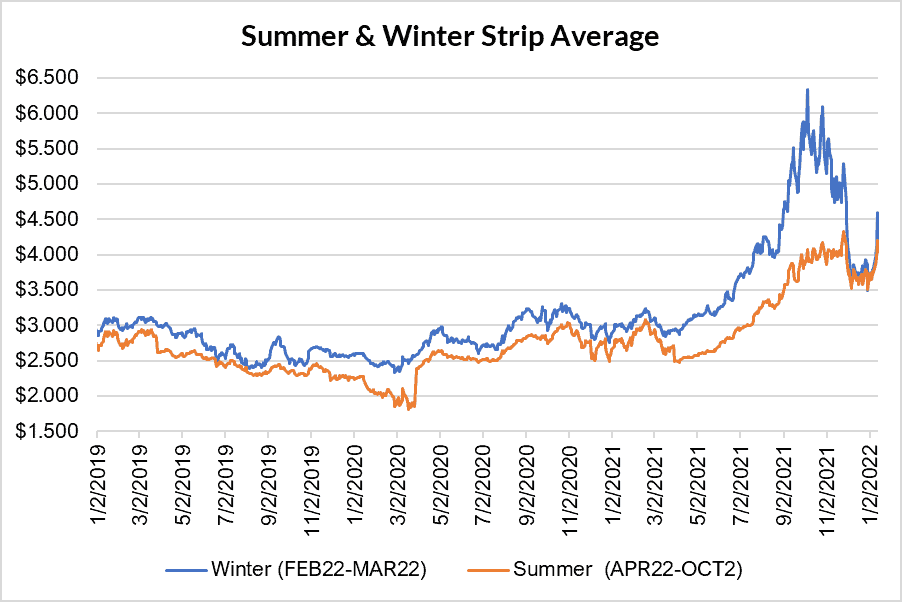
The balance of the winter strip settled Thursday at $4.138/Dth, up 39.7 cents from the week prior. The summer strip (APR22-OCT22) settled at $4.030/Dth, up 31.2 cents from the week prior.
Calendar Years 2022/2023/2024
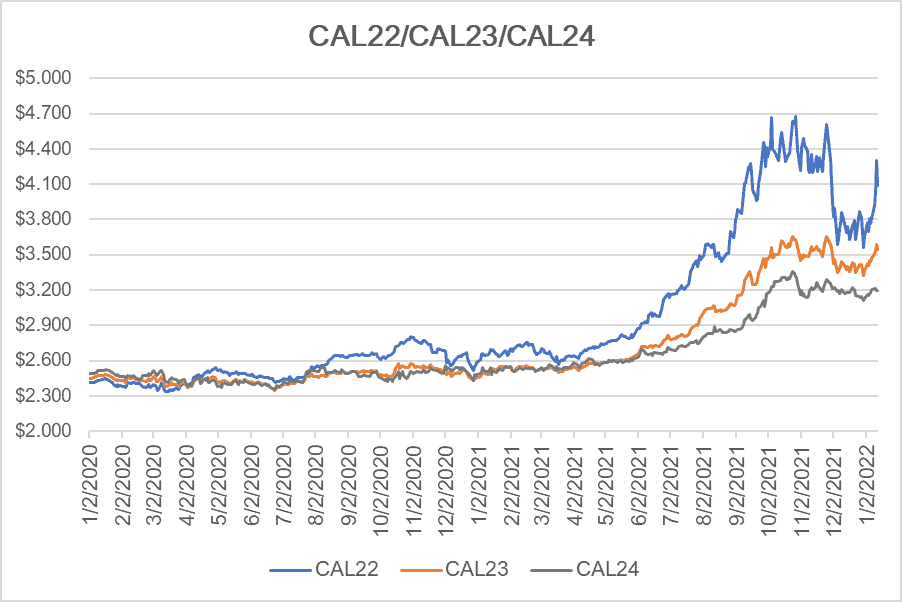
CY22 settled Thursday at $4.090/Dth, up 32.3 cents from the prior week.
CY23 settled Thursday at $3.544/Dth, up 10.5 cents from the prior week.
CY24 settled Thursday at $3.194/Dth, up 1.8 cents from the prior week.
Crude Oil
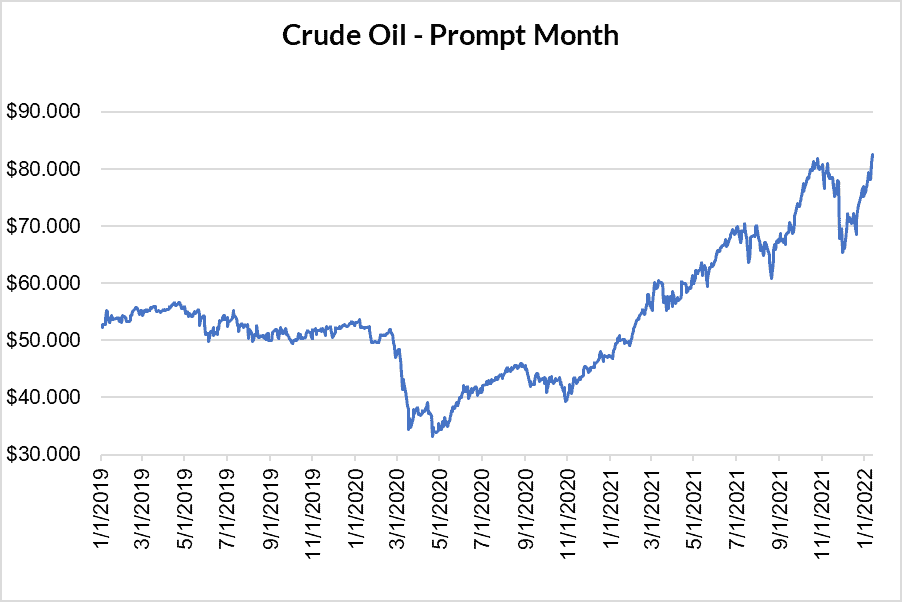
Settled Thursday at $82.12/barrel, up $2.66 from the prior week.
Need Help Making Sense of Natural Gas Prices?
Give us a call. We can help you manage risk and navigate the current price volatility.
We’ll evaluate your current contract and explore your natural gas buying options.
Call us at 866-646-7322 for a no-cost, no-obligation analysis today.