Natural gas report week, January 6, 2022 was marked by a small withdrawal from storage of 31 Bcf which was notably below analysts’ expectations that averaged 49 Bcf. It was also well below last year’s draw for the same week (127 Bcf) and the five-year average withdrawal of 108 Bcf.
Will the small withdrawal and mild short-term forecasts subdue upward price movement?
Near Term Key Points
Although prompt month and strip prices rose more than 20.0 cents week-over week, the Wednesday to Thursday slide in February prices following publication of the EIA weekly storage numbers suggested market suspicion about demand recovery.
Nonetheless, “Total US demand increased 9.8 Bcf day over day on Jan. 6, according to Platts Analytics. Residential and commercial drove most of the increase, with a 7.1 Bcf/d gain. The Midwest region was responsible for the bulk of the increase. The power sector is expected to add another 2.2 Bcf of gas demand Jan. 6, with most of this coming from a 1.6 Bcf increase in Texas.
Platts Analytics’ supply and demand model currently forecasts a 176 Bcf draw for the week in progress, which is more than the five-year average. An early look at the week ending Jan. 14 points to a drawdown of more than 200 Bcf.”
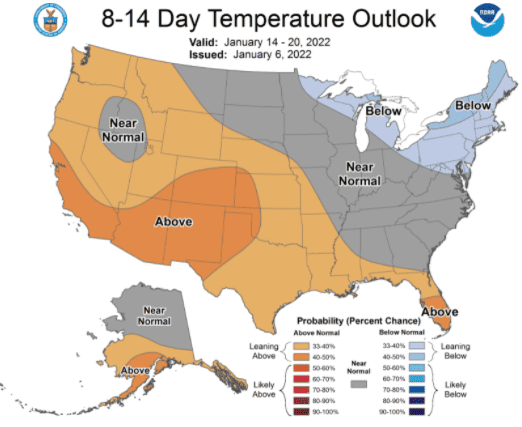
Even so, with NOAA 8-14 day forecasts pointing to warmer weather, it’s unclear if heating demand alone can sustain analysts’ projections.
MAR22, settled at $3.670/Dth up 23.5 cents
APR22, settled at $3.627/Dth up 22.7 cents
MAY22, settled at $3.645/Dth up 21.4 cents
JUN22, settled at $3.696/Dth up 21.0 cents
Natural Gas Fundamentals – 2021 Summary
The EIA’s December Short Term Energy Outlook provided updated data and natural gas industry highlights from 2021. Here are a few key takeaways:
– Production averaged 93.4 Bcf/d, above the 2019 pre-pandemic high of 92.9 Bcf/d.
– Consumption increased just 0.2 Bcf/d from 2020 (83.3 Bcf/d) to 2021 (83.5 Bcf/d). While gradually recovering to pre-pandemic levels, demand still fell short of the 2019 average of 85.3 Bcf/d. Of all demand sectors, residential/commercial grew the most, increasing 3.7% from 2020 to 2021 as a result of extreme winter temperatures which drove use for heating.
– LNG exports averaged 9.8 Bcf/d through 2021, a 50% increase from 2020. The EIA projects LNG exports will average 11.5 Bcf/d for 2022, a 17% increase from 2021.
Natural Gas Market Report – January 6, 2022
February NYMEX
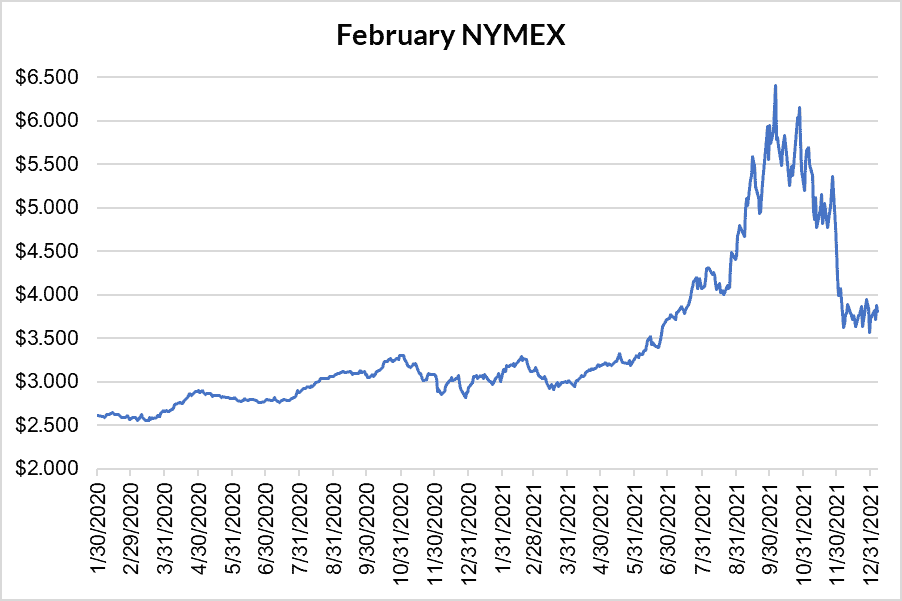
February settled Thursday at $3.812/Dth down 7.0 cents from Wednesday’s close at $3.882/Dth, but up 25.1 cents week-over-week.
12 Month Strip
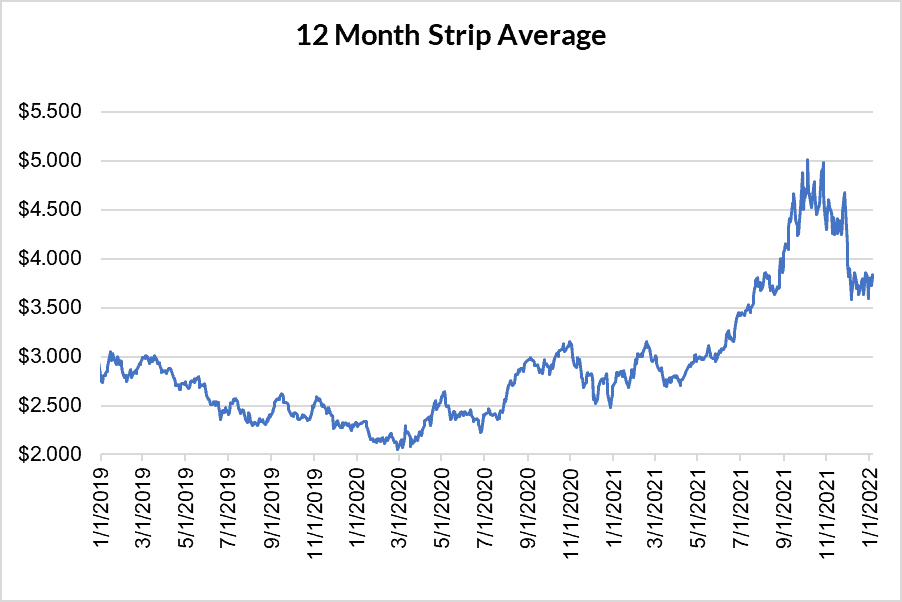
Settled Thursday at $3.800/Dth, up 20.5 cents from the prior week.
Seasonal Strips
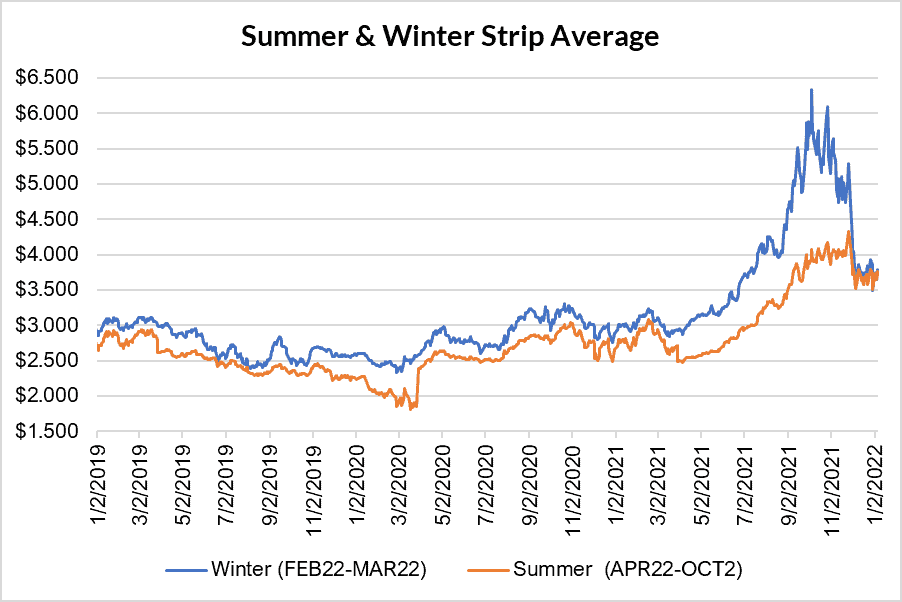
The balance of the winter strip settled Thursday at $3.741/Dth, up 24.3 cents from the week prior. The summer strip (APR22-OCT22) settled at $3.718/Dth, up 20.9 cents from the week prior.
Calendar Years 2022/2023/2024
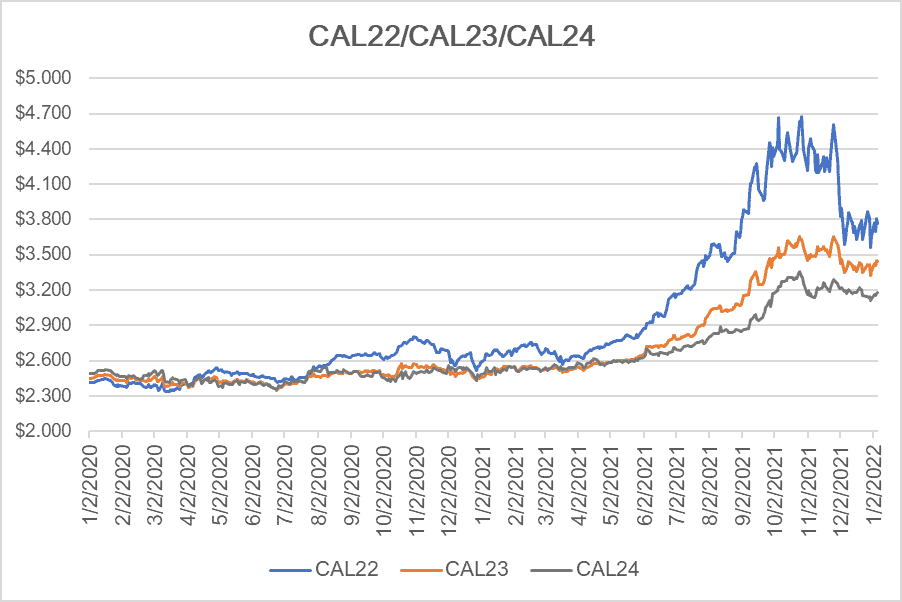
CY22 settled Thursday at $3.767/Dth, up 20.9 cents from the prior week.
CY23 settled Thursday at $3.439/Dth, up 11.6 cents from the prior week.
CY24 settled Thursday at $3.176/Dth, up 6.9 cents from the prior week.
Crude Oil
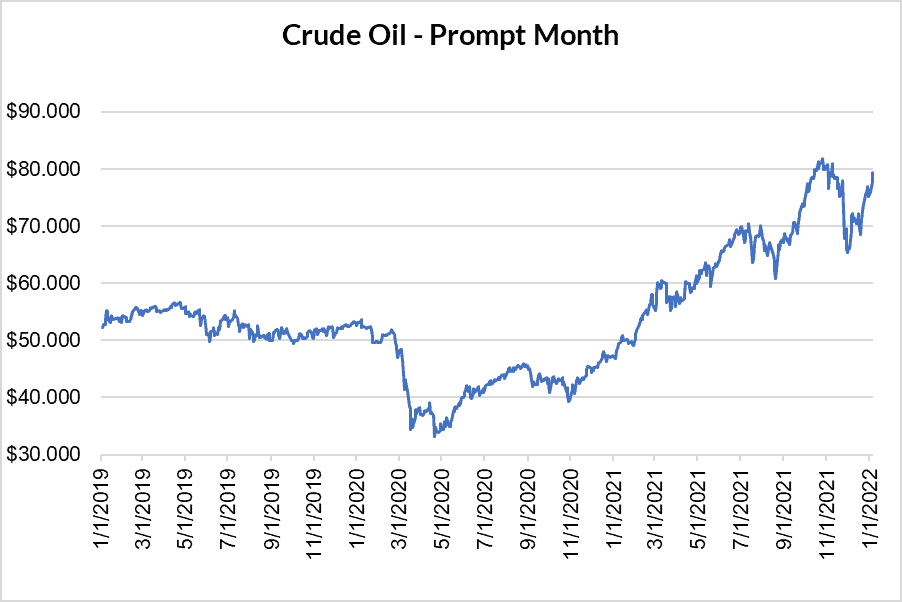
Settled Thursday at $79.46/barrel, up $2.47 from the prior week.
Need Help Making Sense of Natural Gas Prices?
Give us a call. We can help you manage risk and navigate the current price volatility.
We’ll evaluate your current contract and explore your natural gas buying options.
Call us at 866-646-7322 for a no-cost, no-obligation analysis today.