The headline for natural gas report week, January 27, 2022 is most certainly February’s dramatic settle at $6.265. The rally, which set the record for the largest single day gains (46%) in recorded history, followed EIA release of weekly storage numbers. Although the draw of 219 Bcf exceeded both last year’s withdrawal of 137 Bcf and the five-year average of 161 Bcf, it was little surprise for analysts who anticipated withdrawals ranging from 198 Bcf to 231 Bcf.
With numbers generally aligned with analysts’ expectations, what prompted the extreme market movement?
Natural Gas Outlook
It was cold last week. Perhaps even unseasonably so. This contributed to a 21.4% week-over-week increase (9.9 Bcf/d) in residential-commercial consumption which is largely heating-related demand. Additionally, use in power generation, exports to Mexico, and in the industrial sector all grew over the prior week. At the same time, production slightly dropped as the supply total was bolstered only by a 10.9% weekly increase in imports from Canada.
The overall 14.2% increase in demand along with the slight dip in production dragged the overall storage total below the five-year average for the first time in weeks. But even this wasn’t a surprise to analysts who have recently started projecting end-of-season storage figures at a deficit to the five-year average.
To this end, presently, the average rate of withdrawal from storage is 7% below the five-year average. If that rate keeps pace with the five-year average of 13.8 Bcf/d until the end of withdrawal season on March 31, total inventory will be 1,641 Bcf, which is 25 Bcf lower than the five-year average of 1,666 Bcf.
Should that forecast hold accurate, even that picture is not one of an alarming shortfall at the close of winter withdrawal season. So that much leaves little explanation for this week’s wild market volatility.
The February Natural Gas Short Squeeze
Reuters reported that, “Prices rose from $4.84 per million British thermal units (mmBtu) at 2 p.m. EST (1900 GMT) to a high of $7.35 at 2:14 p.m. before settling at $6.27, the highest close for the front-month since October 2021.” This is in contrast to typical prompt-month settles which have gained, on average, “12.1 cents in 12 of the past 14 months on their final trading day,” according to analysts at EBW Analytics Group.
The cause for the anomaly has more to do with the market than it does traditional winter fundamentals. Based on a report by Oilprice.com, the “…price movement is certainly more about a short squeeze than about demand forecasts. According to data compiled by Bloomberg, hedge funds have been net-long on nat gas contracts, expecting prices to rise. But money managers have still held onto a fair share of short positions. Given the price spike, it is clear that some of those money managers waited until the eleventh hour to cover their short bets.”
If you are interested in learning more about the February Short Squeeze, this article from Bloomberg is a good place to start.
APR22, settled at $4.207/Dth up 55.9 cents
MAY22, settled at $4.233/Dth up 54.0 cents
JUN22, settled at $4.275/Dth up 52.7 cents
JUL22, settled at $4.325/Dth up 51.7 cents
AUG22, settled at $4.332/Dth up 50.9 cents
SEP22, settled at $4.310/Dth up 50.3 cents
Natural Gas Market Report – January 27, 2022
March NYMEX
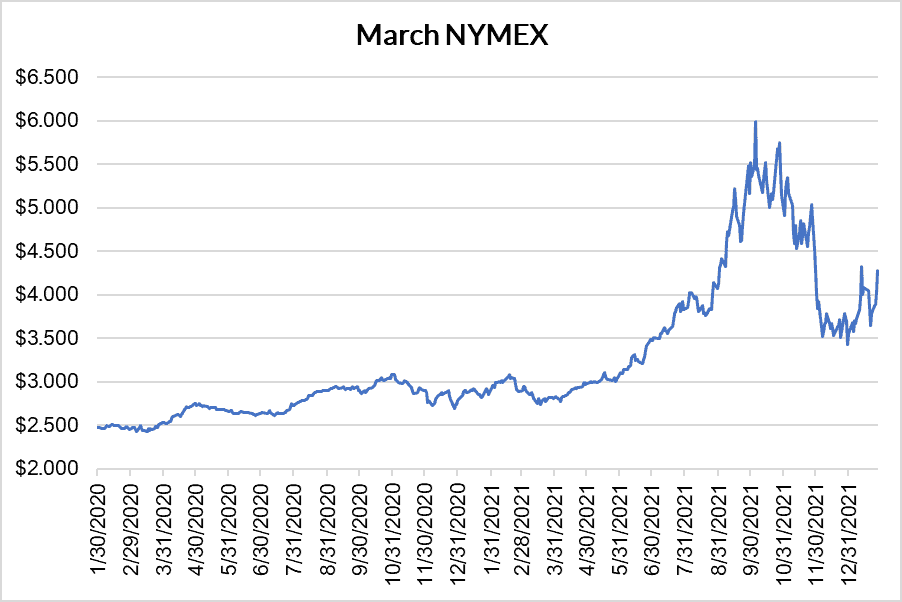
February moved off the board Thursday, January 27th, settling the month at $6.265/Dth.
March settled Thursday at $4.283/Dth, up 24.7 cents from Wednesday’s close at $4.036/Dth and up 63.4 cents week-over-week.
12 Month Strip
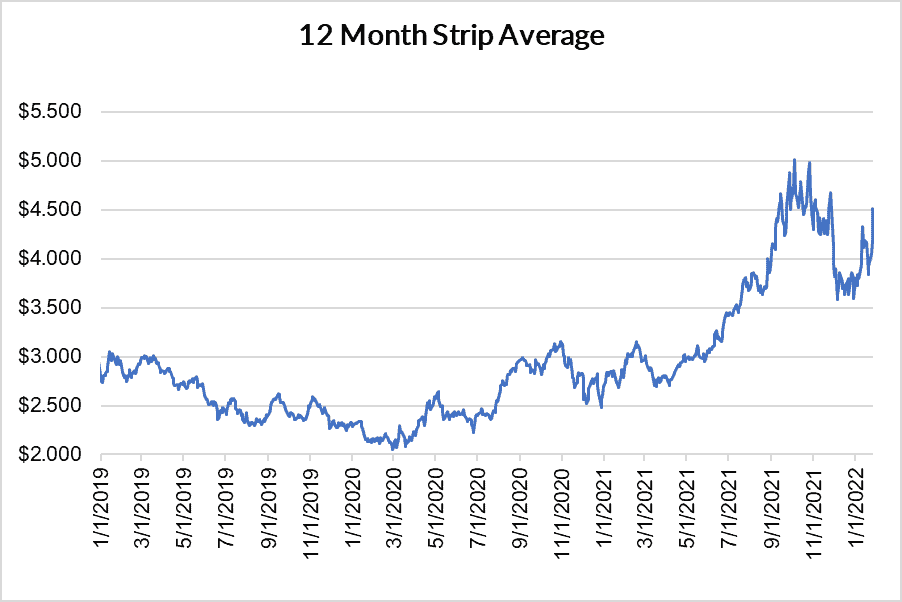
Settled Thursday at $4.517/Dth, up 67.8 cents from the prior week.
Seasonal Strips
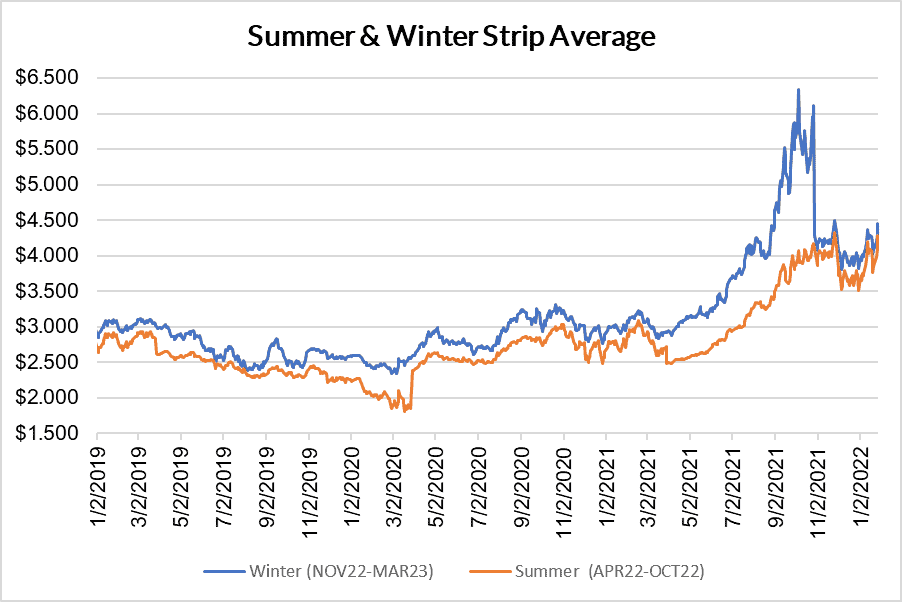
The upcoming summer strip (APR22-OCT22) settled at $4.288/Dth, up 52.2 cents from the week prior.
The winter forward (NOV22-MAR23) settled Thursday at $4.461/Dth, up 43.9 cents from the week prior.
Calendar Years 2022/2023/2024
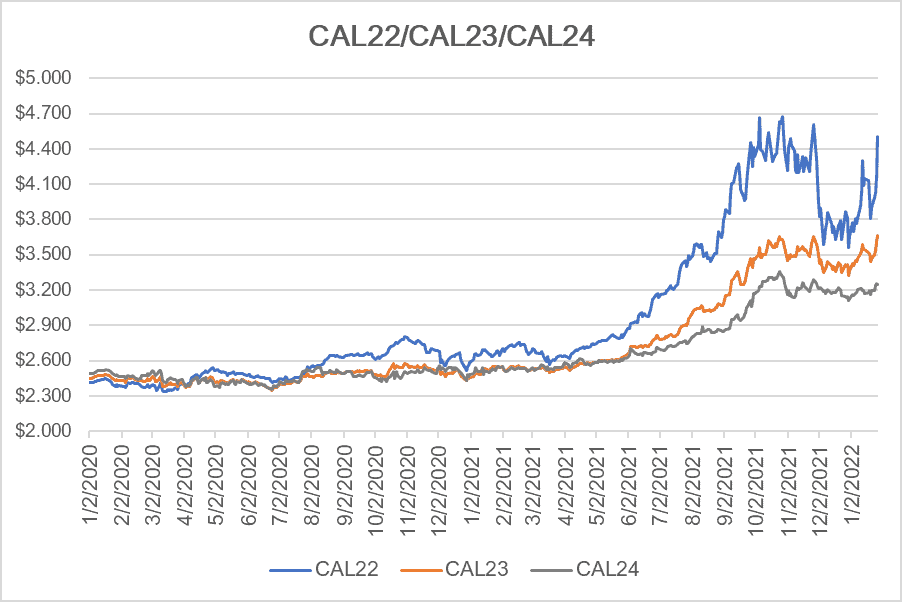
CY22 settled Thursday at $4.504/Dth, up 69.9 cents from the prior week.
CY23 settled Thursday at $3.662/Dth, up 21.7 cents from the prior week.
CY24 settled Thursday at $3.249/Dth, up 8.3 cents from the prior week.
Crude Oil
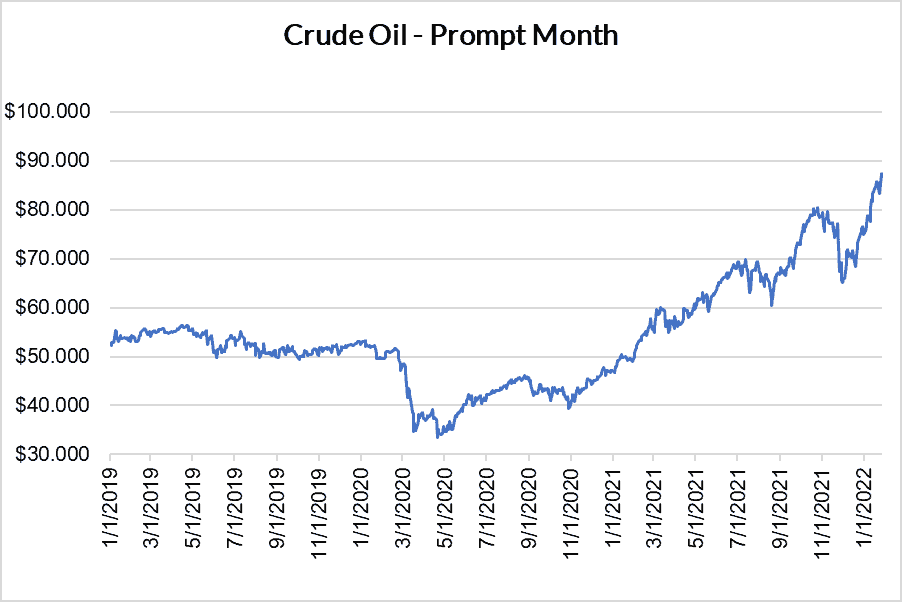
Settled Thursday at $86.61/barrel, up $1.06 from the prior week.
Need Help Making Sense of Natural Gas Prices?
Give us a call. We can help you manage risk and navigate the current price volatility.
We’ll evaluate your current contract and explore your natural gas buying options.
Call us at 866-646-7322 for a no-cost, no-obligation analysis today.
