For natural gas report week, July 16, 2020, the EIA reported a net increase in storage of 45 Bcf. The build was in line with forecasts of injections ranging from 38 Bcf to 52 Bcf, averaging 48 Bcf. Last year for the same week there was an injection of 67 Bcf and the five-year average is 63 Bcf.
Working gas in storage was 3,178 Bcf as of Friday, July 10th, 2020 per EIA estimates. Inventory was reported at 663 Bcf (26.4%) higher than last year for the same week and 436 Bcf (15.9%) more than the five-year average of 2,742 Bcf.
Natural Gas Market Recap
August NYMEX
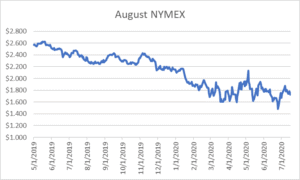
August settled Thursday at $1.723/Dth down 5.5 cents from Wednesday’s close at $1.778/Dth
12 Month Strip
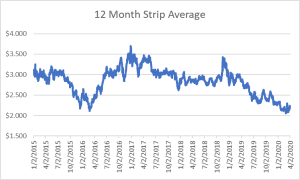
Settled Thursday at $2.407/Dth, down less than a penny from the prior week.
Seasonal Strips
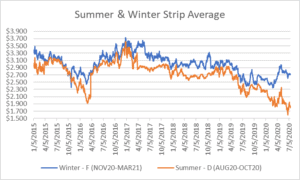
The summer strip (AUG20-OCT20) settled Thursday at $1.793/Dth, down 4.8 cents from the week prior. The winter strip (NOV20-MAR21) settled at $2.711/Dth, up less than a penny from last week.
Natural Gas Weekly
Natural Gas Report – July 16, 2020
Natural Gas Fundamentals
Overall supply averaged 93.8 Bcf/d last week as imports from Canada increased by 11.3% while production fell by 0.7%.
The average rate of injections into storage is 12% more than that of the five-year average for this point in the refill season. If the injection rate matched the five-year average of 8.7 Bcf/d through the end of refill season (October 31st), withdrawal season would begin with 4,159 Bcf in storage, which is 436 Bcf higher than the five-year average of 3,723 Bcf.
Total demand grew by 0.9% from the prior report week, averaging 84.4 Bcf/d. Consumption for power generation increased by 1.2%. Exports to Mexico grew by 5.9% and industrial demand rose by 1.3% from last week. Residential-commercial consumption declined by 1.3%.
LNG pipeline receipts increased slightly from 3.1 Bcf/d to 3.3 Bcf/d. Four LNG vessels with a combined carrying capacity of 15 Bcf departed the U.S. between July 9 and July 15, 2020. That’s down three vessels and 10 Bcf from the end of June.
The number of rigs in operation increased by 3 to 279 according to data from Enverus. Baker Hughes rig data shows natural gas specific rigs are down by four to 71 from last week which is103 less than last year at this time.
Natural Gas For Power Generation Up First Half of 2020
According to the EIA, Natural gas-fired generation increased 9%, in the first half of 2020. It was the fastest-growing source of electric power generation. The increase is the result of low prices and comes despite a 5% decline in total electricity generation. The decrease in electricity consumption is partially attributable to reduced business activity as a result of COVID-19 mitigation efforts.
Coal-fired generation decreased 30% in the first half of 2020. Natural gas became a financially preferable option to coal amid historic low natural gas prices.