For natural gas report week, July 9, 2020, the EIA reported a net increase in storage of 56 Bcf. The build was in line with forecasts of injections ranging from 50 Bcf to 66 Bcf, averaging 56 Bcf. Last year for the same week there was an injection of 83 Bcf and the five-year average is 68 Bcf.
Working gas in storage was 3,133 Bcf as of Friday, July 3rd, 2020 per EIA estimates. Inventory was reported at 685 Bcf (28.0%) higher than last year for the same week and 454 Bcf (16.9%) more than the five-year average of 2,679 Bcf.
Natural Gas Market Recap
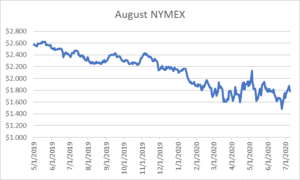
August NYMEX

August settled Thursday at $1.779/Dth down 4.5 cents from Wednesday’s close at $1.824/Dth.
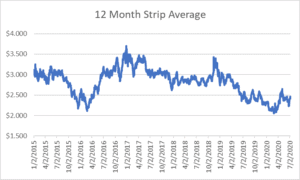
12 Month Strip

Settled Thursday at $2.413/Dth, down less than a penny from the prior week.
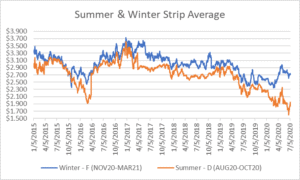
Seasonal Strips

The summer strip (AUG20-OCT20) settled Thursday at $1.841/Dth, up 4.0 cents from the week prior. The winter strip (NOV20-MAR21) settled at $2.702/Dth, down 2.2 cents from last week.
Natural Gas Weekly
Natural Gas Report – July 9, 2020
Natural Gas Fundamentals
Overall supply averaged 93.9 Bcf/d last week as imports from Canada increased by 2.4% while production grew by 1.4%.
The average rate of injections into storage is 15% more than that of the five-year average this point in the refill season. If the injection rate matches the five-year average of 8.7 Bcf/d through the end of refill season (October 31st), withdrawal season will begin with 4,177 Bcf in storage, 454 Bcf higher than the five-year average of 3,723 Bcf.
Total demand grew by 1.5% from the prior report week, averaging 83.4 Bcf/d. Consumption for power generation increased by 6.9%. Exports to Mexico fell by 5.4% and industrial demand decreased by .98% from last week. Residential-commercial consumption remained steady, averaging 8.7 Bcf/d.
LNG pipeline receipts decreased by 29.5%, falling from 4.4 Bcf/d to 3.1 Bcf/d. That’s a 50% decline from last year at this time. According to S&P Global Platts, an increase in cargo cancellations provides an explanation. “More than 40 LNG cargoes scheduled to be loaded in August at US export terminals were canceled by customers, similar to July figures, market sources said. That new cancellations push the summer total over 100.”
The number of rigs in operation increased by 5 to 276 according to data from Enverus. Baker Hughes rig data shows natural gas specific rigs are down by one to 75 from last week, 97 less than last year at this time.
Natural Gas Prices
While natural gas futures price movement across the report week is generally marked by slight losses, it’s only part of the story. Over the last two weeks, prompt month prices are up 23.9 cents, 12-month strip up 18.8 cents, the balance of the summer strip up 24.8 cents, and the winter strip up 9.5 cents.
The bearish price environment may have summer weather to thank. Natural gas used for power generation is up in recent weeks due to warm summer temperatures. At the same time sluggish production resulted in injections totaling below last year and the five-year average. Following a week of Midwest temperatures that set 2020’s current PJM peak demand days, analysts have looked to forecasts to understand where prices may move. If weather is a factor, it may be a bullish predictor as a hotter-than-average finish to July is expected for much of the country, especially in the Midwest and Northeast.
Analyst Andy Weisman cautions tumbling LNG demand may undercut hot weather’s contribution.
If the crude oil market can sustain the gains seen in this week’s above-$40/bbl settle, it may prompt reactivation of curtailed wells. This, in turn, will contribute to higher associated natural gas production, adding to an already healthy (and bearish) storage surplus to the five-year average.
Energy Industry Warning Signs?
By late April, trouble surrounding global oversupply of oil drove prices below zero for the first time in U.S. history. Failed OPEC talks in March collided with demand destruction brought about by early COVID-19 control efforts. As prices remained low, energy producers confronted investors concerned by evaporating profits. Under pressure to protect profitability, producers cut capital budgets and eliminated infrastructure projects. The latest such casualty is the cancellation of the Atlantic Coast pipeline project, a cooperative venture between Dominion Energy Incorporated and Duke Energy Corporation. According to a joint statement, the decision resulted from legal delays and cost uncertainty.
A Miscalculation
Early CNBC analysis suggested the overall impact to the industry would be contained, as debt wasn’t the immediate problem for most drillers. “As markets for energy companies’ bonds crater on lower crude oil prices, bond analysts offer one big piece of comforting news amid the chaos: Very few major energy companies have any debt due before next year, when the crisis sparked by the COVID-19 coronavirus is likely to be over. Of $86 billion in debt that exploration and production companies have to refinance or repay by 2024, only $5.3 billion is due this year, and only $1.7 billion of that is junk. The biggest chunk is due in 2022, at $25.7 billion.”
The Cost
Nonetheless, this week, reports of surging energy company bankruptcies claimed headlines. In 2Q 2020, eighteen energy companies filed for bankruptcy. That brings the total to 23 so far this year amounting to over $30 billion in debt, with roughly $11 billion of it secured. The list includes companies such as Chesapeake Energy Corporation, Whiting Petroleum Company, and Chisholm Oil and Gas Operating, LLC. According to Dallas law firm Haynes and Boone, the bankruptcy trend is likely to continue for energy producers. “Until full economic activity returns and consumer confidence that the worst of the pandemic is behind us, demand levels will not pull up prices. It is reasonable to expect that a substantial number of producers will continue to seek protection from creditors in bankruptcy, even if oil prices recover over the next few months.”
