For natural gas report week, July 30, 2020, the EIA reported a net increase in storage of 26 Bcf. The build was in line with forecasts of injections ranging from 17 Bcf to 32 Bcf, averaging 24 Bcf. Last year for the same week there was an injection of 56 Bcf and the five-year average is 33 Bcf.
Working gas in storage was 3,241 Bcf as of Friday, July 24th, 2020 per EIA estimates. Inventory was reported at 626 Bcf (23.9%) higher than last year for the same week and 429 Bcf (15.3%) more than the five-year average of 2,812 Bcf.
Natural Gas Market Recap
September NYMEX
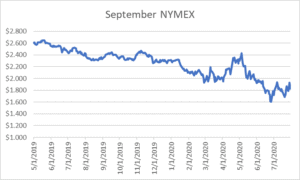
September settled Thursday at $1.829/Dth down 10.1 cents from Wednesday’s close at $1.930/Dth
August moved off the board Wednesday, July 29th, settling the month at $1.854/Dth.
12 Month Strip
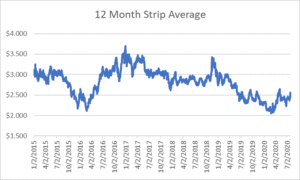
Settled Thursday at $2.560/Dth, up 13.8 cents from the prior week.
Seasonal Strips
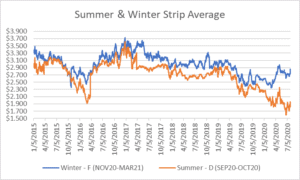
The summer strip (SEP20-OCT20) settled Thursday at $1.910/Dth, up 5.3 cents from the week prior. The winter strip (NOV20-MAR21) settled at $2.791/Dth, up 8.3 cents from last week.
Natural Gas Weekly
Natural Gas Report – July 30, 2020
Natural Gas Fundamentals
Overall supply averaged 94.4 Bcf/d last week with production increasing slightly by 0.2%. Meanwhile, imports from Canada fell by 2.1%.
The average rate of injections into storage is 11% more than that of the five-year average for this point in the refill season. If the injection rate matched the five-year average of 9.2 Bcf/d through the end of refill season (October 31st), withdrawal season would begin with 4,152 Bcf in storage, which is 429 Bcf higher than the five-year average of 3,723 Bcf.
Total demand grew by 0.9% from the prior report week, averaging 85.7 Bcf/d. Consumption for power generation increased by 0.7%, hitting 43.6 Bcf/d on Monday. Industrial and residential-commercial consumption increased by 1.3% and 0.6%, respectively. Exports to Mexico remained steady at 5.6 Bcf/d.
LNG pipeline receipts are down by 0.5 Bcf/d. Seven LNG vessels with a combined carrying capacity of 25 Bcf departed the U.S. between July 23 and July 29, 2020.
The number of rigs in operation decreased by 9 to 283 according to data from Enverus. Baker Hughes rig data shows natural gas specific rigs are down by three to 68 from last week which is 101 less than last year at this time.
COVID Energy Consumption Impacts
Amid the peak of COVID containment efforts, overall U.S. energy consumption fell to the lowest level since September 1989 according to the EIA. April 2020 consumption dropped 14% from April 2019, the largest year-over-year decrease in EIA’s monthly reporting history which began in 1973.
Stay-at-home orders likewise impacted consumption of petroleum products which declined from 20.1 million b/d to 14.7 million b/d, year-over-year.
While other energy sectors experienced declines in consumption, natural gas saw a 2% increase, driven by a 15% gain in residential use of natural gas. Due in part to cooler temperatures in April 2020 than April 2019, heating-related demand surged. Additionally, low prices made natural gas a cost-effective alternative to coal and nuclear for power generation.
Natural Gas Price Spike Looming?
The COVID-related decline in oil consumption occurred at a time when oil was already oversupplied. With available storage space short and little market for the excess supply, prices dropped from first quarter lows.
The EIA indicates that economic outlook doesn’t show signs of changing. “The $48 billion in write-downs in the first quarter of 2020 represented the largest decline in value recognized by these companies since at least 2015. These first-quarter adjustments, combined with crude oil prices that have remained much lower than 2019 levels during the second quarter of 2020, indicate that the net present value of proved reserves could continue to decline.”
Production Cuts
This has already led to well shut-ins and production cuts. While natural gas specific rigs are down almost 60% from last year, reduced associated gas production also represents a large portion of the loss.
The Journal of Petroleum Technology forecasts this is likely to persist through 2022. “Since the US produces about half of the associated gas worldwide, it will experience the greatest drop in correlation with the drop in oil production. Production may tumble 5.5% compared to 2019 levels—and may not recover to 2019 levels until 2023.”
A Bullish Winter?
Now, with production falling and demand slowly returning to last year’s levels, is a bullish price scenario on the horizon? One analyst expects prices to double.
As we predicted back in April emergence from shutdowns has gradually began to restore demand, specifically for industrial consumption, power generation, and LNG exports. At the same time, production cuts have led to substantially smaller injections. Across the last four weeks, injections have dropped sharply from 120 Bcf to just 26 Bcf.
While short-term prices have remained tied to weather, winter prices reflect a market sentiment that contracting supply will collide with winter demand. According to S&P, “Balance-2020 forwards prices at the Henry Hub are up sharply over the past month as rising gas demand and a recent contraction in supply bolster the outlook for winter gas prices.”