
For natural gas report week July 8, 2021, the EIA reported a net increase in storage of 16 Bcf. The injection was at the low end of forecasts which ranged from 16 Bcf to 58 Bcf and averaged 27 Bcf. In comparison, last year for the same week there was an injection of 57 Bcf and the five-year average is an injection of 63 Bcf.
Working gas in storage was 2,574 Bcf as of Friday, July 2, 2021 per EIA estimates. Inventory was 551 Bcf (-17.6%) less than last year for the same week and 190 Bcf (-6.9%) below the five-year average of 2,764 Bcf.
Natural Gas Market Recap
August NYMEX
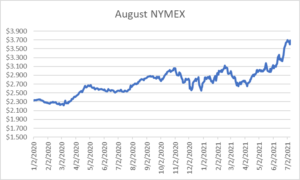
Settled Thursday at $3.688/Dth, up 9.2 cents from Wednesday’s close at $3.596/Dth.
12 Month Strip
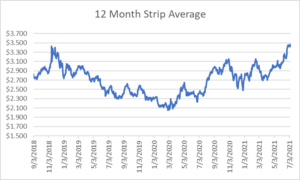
Settled Thursday at $3.472/Dth, up 5.3 cents from the prior week.
Seasonal Strips
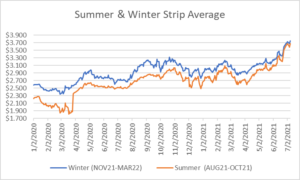
The summer strip (AUG21-OCT21) settled Thursday at $3.674/Dth, up 3.5 cents from the week prior. The winter strip (NOV21-MAR22) settled Thursday at $3.752/Dth, up 6.6 cents from the week prior.
Natural Gas Report – July 8, 2021
Natural Gas Fundamentals
Overall supply averaged 97.1 Bcf/d last week as production fell by 0.6%, week over week. Meanwhile, imports from Canada grew by 3.0%.
Total demand rose by 6.0% from the prior report week, averaging 87.8 Bcf/d. Residential-commercial demand and use in power generation increased 4.1% and 5.8% respectively. Meanwhile, LNG pipeline receipts averaged 10.9 Bcf/d, remaining steady week over week.
Up to this point in injection season, the average rate of injections is 17% lower than the five-year average. If the rate of injections matched the five-year average of 7.9 Bcf/d, inventory would be 3,529 Bcf at the close of refill season. That’s 190 Bcf lower than the five-year average of 3,719 Bcf.
Natural Gas Prices
Cooler temperatures throughout much of the country gave way to week-over-week declines in spot prices in most regions. Although NYMEX prices continued to rise over the report week, there are signs the bullish sentiment that characterized May and June may be starting to deflate. It’s likely weather will continue to impact this outlook, at least for the short term. Should temperatures remain mild and continue to result in decreased demand for use in power generation, the next few storage injections will more closely match pace with the five-year average. Effectively, that will help ease the overall storage deficit to the five-year average that’s been sustaining bullish sentiment. But…the direction of the mercury looks to be a toss-up at this point. Initial forecasts suggested the heat would hover over the west coast while NOAA 8-14 paints a different picture. I’ll let you decide…
DEC21, settled at $3.816/Dth, up 6.4 cents
JAN22, settled at $3.875/Dth, up 6.1 cents
FEB22, settled at $3.792/Dth, up 6.4 cents
MAR22, settled at $3.555/Dth up 8.2 cents
APR22, settled at $3.016/Dth up 5.2 cents
Strips
24 Month, settled at $3.199/Dth up 4.0 cents
36 Month, settled at $3.038/Dth up 2.8 cents
Other Price Considerations
Since market behavior is generally tethered to supply/demand fundamentals, understanding the long-term forecast warrants a look at a few elements that will likely impact prices: power consumption, renewables, and LNG exports.
Power Generation
The EIA expects natural gas use in power generation will average 36% in 2021 and 2022. That’s down 3% from 39% in 2020. They attribute the decline to increased natural gas prices that will make coal a more affordable fuel in the generation mix. This represents a decline in one aspect of natural gas demand. So, short term natural gas prices are up. The higher prices mean decreased demand for power generation. Without an offset, that means more going into storage. More storage, less price support. This plays out in EIA forecasts for overall demand, “U.S. natural gas consumption averaged 83.3 Bcf/d in 2020, down 2.2% from 2019. We expect that natural gas consumption will decline by 1.1% in 2021 and then grow by 0.7% in 2022.”
Renewables
According to EIA forecasts, solar and wind generation will continue to grow over the next two years, rising from “11% in 2020 to 15% by 2022.” These gains in the electric generation mix will be largely offset by declines in nuclear power and hydropower. As such, renewables, at this point don’t represent a substantial threat to reliance on natural gas for power generation. To this end, the trade off for natural gas will be coal. With sustainability a focus of the current administration, once natural gas prices come back down, demand will return.
LNG Exports
This has been one of the demand aspects to recover the most quickly post-COVID. To put it in perspective, last year at this time, LNG pipeline receipts averaged 3.3 Bcf/d. This week that figure was 10.9 Bcf/d. So it was something of a surprise that last month the EIA announced they expected LNG exports to rise throughout 2021 and then decline in 2022. “The agency forecast U.S. LNG exports would rise to 9.38 billion cubic feet per day (bcfd) in 2021 from a record 6.53 bcfd in 2020, before sliding to 9.22 bcfd in 2022.” To keep it interesting, “No other analyst as seen by Reuters has called for U.S. LNG exports to decline in 2022 especially with new export trains expected to start producing LNG later this year at Sabine Pass and Calcasieu Pass in Louisiana.” Clear as mud? Since everyone seems to agree that exports will rise throughout 2021, we’ll have to flag this one as a wait-and-see. Stay tuned.
Do you have the best natural gas contract for your business?
We can help you evaluate your current contract and explore your natural gas buying options. Call us at 866-646-7322 for a no-cost, no-obligation analysis today.