For natural gas report week June 10, 2021, the EIA reported a net increase in storage of 98 Bcf. The build was in line with forecasts ranging from injections of 88 Bcf to 106 Bcf, averaging 97 Bcf. Last year for the same week there was an injection of 95 Bcf and the five-year average is an injection of 92 Bcf.
Working gas in storage was 2,411 Bcf as of Friday, June 4, 2021 per EIA estimates. Inventory was 383 Bcf (-13.7%) less than last year for the same week and 55 Bcf (-2.2%) below the five-year average of 2,466 Bcf.
Natural Gas Market Recap
July NYMEX
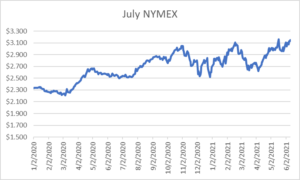
Settled Thursday at $3.149/Dth, up 2.0 cents from Wednesday’s close at $3.129/Dth.
12 Month Strip
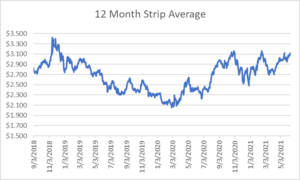
Settled Thursday at $3.118/Dth, up 8.4 cents from the prior week.
Seasonal Strips
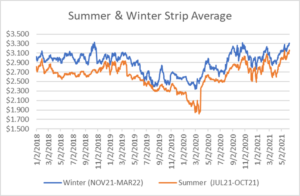
The summer strip (JUL21-OCT21) settled Thursday at $3.163/Dth, up 10.7 cents from the week prior. The winter strip (NOV21-MAR22) settled Thursday at $3.313/Dth, up 9.3 cents from the week prior.
Natural Gas Weekly
Natural Gas Report – June 10, 2021
Fundamentals
Overall supply averaged 98.0 Bcf/d last week as production grew by 0.4%, week over week. Meanwhile, imports from Canada rose by 19.8%.
Total demand increased by 6.4% from the prior report week, averaging 86.6 Bcf/d. Residential-commercial use dropped by 25.8% while consumption for power generation grew by 27.0%. Industrial demand fell by 2.8% and exports to Mexico decreased by 1.0%.
LNG pipeline receipts averaged 9.4 Bcf/d. Seventeen LNG vessels with a combined carrying capacity of 61 Bcf departed the U.S. between June 3 and June 9, 2021.
Baker Hughes rig data shows the overall number of rigs in operation decreased by one, down to 456. Natural gas specific rigs decreased by one from last week, down to 97.
Up to this point in injection season, the average rate of injections is 4% lower than the five-year average. If the rate of injections matched the five-year average of 8.4 Bcf/d, inventory would be 3,664 Bcf at the close of refill season. That’s 55 Bcf lower than the five-year average of 3,719 Bcf.
Natural Gas Prices
Spot prices rose in most regions as the majority of the country experienced above-average temperatures. NYMEX prices continued to gain strength across the report week, most specifically for futures consolidated at the close of injection season through withdrawal season months. On Thursday, DEC21, JAN22, and FEB22 posted week-over-week gains as follows:
DEC21, settled at $3.350, up 9.2 cents
JAN22, settled at $3.428, up 8.8 cents
FEB22, settled at $3.364, up 9.0 cents
Do you have the best natural gas contract for your business?
We can help you evaluate your current contract and explore your natural gas buying options. Call us at 866-646-7322 for a no-cost, no-obligation analysis today.