For natural gas report week June 3, 2021, the EIA reported a net increase in storage of 98 Bcf. The build was in line with forecasts ranging from injections of 86 Bcf to 112 Bcf, averaging 96 Bcf. Last year for the same week there was an injection of 103 Bcf and the five-year average is an injection of 96 Bcf.
Working gas in storage was 2,313 Bcf as of Friday, May 28, 2021 per EIA estimates. Inventory was 386 Bcf (-14.3%) less than last year for the same week and 61 Bcf (-2.6%) below the five-year average of 2,374 Bcf.
Natural Gas Market Recap
July NYMEX
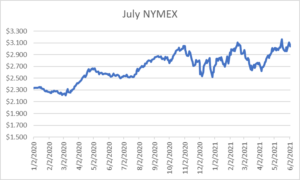
Settled Thursday at $3.041/Dth, down 3.4 cents from Wednesday’s close at $3.075/Dth.
12 Month Strip
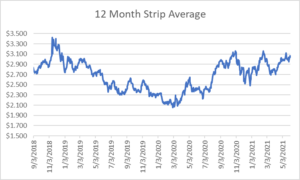
Settled Thursday at $3.046/Dth, up 9.5 cents from the prior week.
Seasonal Strips
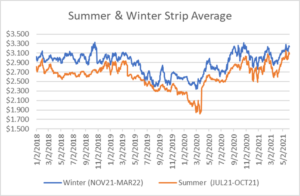
The summer strip (JUL21-OCT21) settled Thursday at $3.078/Dth, up 10.2 cents from the week prior. The winter strip (NOV21-MAR22) settled Thursday at $3.234/Dth, up 9.6 cents from the week prior.
Natural Gas Weekly
Natural Gas Report – June 3, 2021
Natural Gas Fundamentals
Overall supply averaged 96.6 Bcf/d last week as production grew by 0.2%, week over week. Meanwhile, imports from Canada fell by 13.5%.
Total demand rose by 0.7% from the prior report week, averaging 84.0 Bcf/d. Residential-commercial use increased by 24.0% while consumption for power generation fell by 8.0%. Industrial demand grew by 2.7% and exports to Mexico increased by 3.8%.
LNG pipeline receipts averaged 10.9 Bcf/d. Twenty-one LNG vessels with a combined carrying capacity of 76 Bcf departed the U.S. between May 27 and June 2, 2021.
Baker Hughes rig data shows the overall number of rigs in operation increased by two, up to 457. Natural gas specific rigs decreased by one from last week, down to 98.
Up to this point in injection season, the average rate of injections is 6% lower than the five-year average. If the rate of injections matched the five-year average of 8.6 Bcf/d, inventory would be 3,658 Bcf at the close of refill season. That’s 61 Bcf lower than the five-year average of 3,719 Bcf.
Natural Gas Prices
Spot prices remained mixed in response to continued varied temperatures throughout the country, with extreme heat in the West and mild temperatures throughout the Midwest and Northeast. NYMEX prices strengthened across the report week, most specifically for futures consolidated at the close of injection season through withdrawal season months. Both DEC21 and JAN22 gained 8.0 cents over the report week, closing Thursday at $3.258/Dth and $3.340/Dth respectively.
Price Outlook
The likelihood of continued price support, for now, comes down to a few fundamentals.
First, weather. June is expected to be one of the hottest months on record. Extreme heat drives cooling-related power generation demand, which will result in constricted injections provided production remains stable. At current pace, the EIA has forecast we’ll begin withdrawal season at a deficit to the five-year average.
Second, exports will factor into increasing demand. With pipeline projects completed in Texas and Mexico, increased takeaway capacity has contributed to a 5.9 Bcf/d growth in exports to Mexico from March 2020 to March 2021. Similarly, LNG exports have nearly doubled last year’s volumes, jumping from 5.9 Bcf/d to 10.9 Bcf/d, a trend that’s expected to continue as “Global LNG demand is slated to rise 40-50% over the next 10 years and perhaps even double to nearly 100 Bcf/d by the early-2040s,” according to a recent analysis by Forbes.
Finally, production. While decisionmakers contemplate the role natural gas may play as a transition fuel in the walk to a carbon-free future, producers just emerging from a sluggish demand environment amid COVID-related shutdowns seem hesitant to eagerly scale up drilling projects. Prior to the pandemic, the low price environment for both natural gas and oil led to investor calls for capital project cuts. This led to decreased drilling which has been slow to respond to current market demand signals. How this shapes up will certainly impact end-of-season storage totals as well as winter prices.
Do you have the best natural gas contract for your business?
We can help you evaluate your current contract and explore your natural gas buying options. Call us at 866-646-7322 for a no-cost, no-obligation analysis today.