
For natural gas report week June 24, 2021, the EIA reported a net increase in storage of 55 Bcf. The injection was at the low end of forecasts which ranged from 54 Bcf to 78 Bcf and averaged 62 Bcf. Last year for the same week there was an injection of 115 Bcf and the five-year average is an injection of 83 Bcf.
Working gas in storage was 2,482 Bcf as of Friday, June 18, 2021 per EIA estimates. Inventory was 513 Bcf (-17.1%) less than last year for the same week and 154 Bcf (-5.8%) below the five-year average of 2,636 Bcf.
Natural Gas Market Recap
July NYMEX
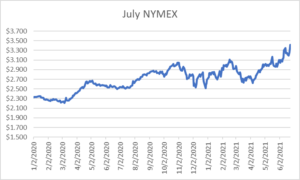
Settled Thursday at $3.418/Dth, up 8.5 cents from Wednesday’s close at $3.333/Dth.
12 Month Strip
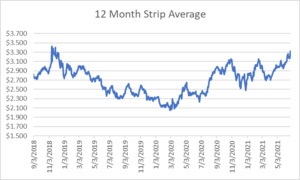
Settled Thursday at $3.326/Dth, up 12.2 cents from the prior week.
Seasonal Strips
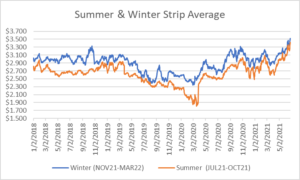
The summer strip (JUL21-OCT21) settled Thursday at $3.423/Dth, up 15.7 cents from the week prior. The winter strip (NOV21-MAR22) settled Thursday at $3.519/Dth, up 12.6 cents from the week prior.
Natural Gas Weekly
Natural Gas Report – June 24, 2021
Natural Gas Fundamentals
Overall supply averaged 97.8 Bcf/d last week as production grew by 0.2%, week over week. Meanwhile, imports from Canada fell by 6.6%.
Total demand dropped by 1.8% from the prior report week, averaging 86.5 Bcf/d. Residential-commercial use increased 3.4% while consumption for power generation dipped by 4.3%. Industrial demand rose by 0.6% and exports to Mexico increased by 3.0% to 7.0 Bcf/d.
LNG pipeline receipts averaged 10.0 Bcf/d. Seventeen LNG vessels with a combined carrying capacity of 62 Bcf departed the U.S. between June 17 and June 23, 2021.
Baker Hughes rig data shows the overall number of rigs in operation increased by nine, up to 470. Natural gas specific rigs increased by one from last week, up to 97.
Up to this point in injection season, the average rate of injections is 15% lower than the five-year average. If the rate of injections matched the five-year average of 8.0 Bcf/d, inventory would be 3,565 Bcf at the close of refill season. That’s 154 Bcf lower than the five-year average of 3,719 Bcf.
Natural Gas Prices
Spot prices continued to climb in most regions in response to increased use in power generation, most significantly in Texas and California. NYMEX prices also rose across the report week, with gains in prompt month pricing, the seasonal strips, as well as the 24- and 36-month strips. Even MAR22 and APR22 posted notable gains.
DEC21, settled at $3.568/Dth, up 13.6 cents
JAN22, settled at $3.638/Dth, up 12.9 cents
FEB22, settled at $3.560/Dth, up 12.0 cents
MAR22, settled at $3.380/Dth up 14.6 cents
APR22, settled at $2.918/Dth up 9.5 cents
Strips
24 Month, settled at $3.108/Dth up 8.5 cents
36 Month, settled at $2.967/Dth up 5.8 cents
Prices On The Rise
The market has remained bullish throughout much of injection season, during a time when storage builds have the potential to subdue prices. However, thus far, much of the summer has been marked by injections well below the five-year average and the prior year for the same timeframe. Although the gap between current storage totals and the five-year average has continued to widen, overall storage amounts are far from dismal and remain well within the five-year historical range. The market may be holding on to expectations for late-season extreme heat which would drive up demand for natural gas used for power generation.
Additionally, increased LNG demand has helped foster a tighter supply/demand balance. According to S&P Global, “The dynamics have been fueled in part by persistent Chinese import strength, strong power-sector driven LNG demand in South Korea, and flat Asian LNG supply year on year.” That trend is expected to continue throughout the end of the year.
Finally, with oil production largely flat since the end of 2020, the impact to associated gas shouldn’t be overlooked. Since it’s captured through crude oil production, this means storage isn’t getting as much of a boost from associated gas as it has in recent years. This will contribute to the narrow supply/demand balance.
Do you have the best natural gas contract for your business?
We can help you evaluate your current contract and explore your natural gas buying options. Call us at 866-646-7322 for a no-cost, no-obligation analysis today.