For natural gas report week, June 25, 2020, the EIA reported a net increase in storage of 120 Bcf. The build exceeded forecasts of injections ranging from 99 Bcf to 116 Bcf, averaging 111 Bcf. Last year for the same week there was an injection of 103 Bcf and the five-year average is 73 Bcf.
Working gas in storage was 3,012 Bcf as of Friday, June 19th, 2020 per EIA estimates. Inventory was reported at 739 Bcf (32.5%) higher than last year for the same week and 466 Bcf (18.3%) more than the five-year average of 2,546 Bcf.
Natural Gas Market Recap
July NYMEX
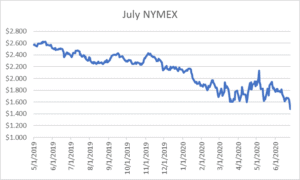
July moved off the board today, Friday, June 26th, settling the month at $1.495/Dth.
August settled Thursday at $1.546/Dth down 11.5 cents from Wednesday’s close at $1.661/Dth.
12 Month Strip
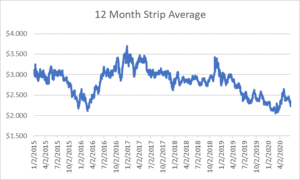
Settled Thursday at $2.225/Dth, down 13.7 cents from the prior week.
Seasonal Strips
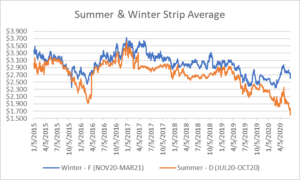
The summer strip (JUL20-OCT20) settled Thursday at $1.593/Dth, down 16.9 cents from the week prior. The winter strip (NOV20-MAR21) settled at $2.607/Dth, down 15.0 cents from last week.
Natural Gas Weekly
Natural Gas Report – June 25, 2020
Natural Gas Fundamentals
Overall supply averaged 92.6 Bcf/d last week as imports from Canada increased by 13.0% while production fell by 0.3%.
The average rate of injections into storage is 18% more than that of the five-year average for this point in the refill season. If the injection rate matched the five-year average of 8.8 Bcf/d through the end of refill season (October 31st), withdrawal season would begin with 4,189 Bcf in storage, which is 466 Bcf higher than the five-year average of 3,723 Bcf.
Total demand grew by 9.8% from the prior report week, averaging 80.7 Bcf/d. Consumption for power generation increased by 20.5%. Likewise, exports to Mexico grew 6.4%. Residential-commercial consumption dropped by 0.1% and industrial demand fell by 1.0% from last week. LNG exports decreased by one LNG vessel to seven with a combined carrying capacity of 25 Bcf.
The number of rigs in operation fell by 6 to 294 according to data from Enverus.
Natural Gas Prices; Cause & Effect
According to analysis from the EIA, low feedgas volumes delivered to LNG export terminals in have put downward pressure on natural gas prices. Also, COVID-related decreases in business and manufacturing activity have led to weaker demand. “Estimates from S&P Global Platts suggest that average industrial natural gas consumption in June 2020 has declined about 2.1 Bcf/d, or 9.6%, compared to June 2019.”
So far this summer, low prices have led to increased consumption for power generation because prices are more competitive than other fuel sources such as coal. June average daily power burn is up about 6% compared to last year, despite no demand growth for electricity.
Additionally, low prices have led to cuts in production. Further production declines are expected as a result of lags between price changes and production adjustments.
More Trouble for TETCO
On Tuesday, TETCO declared a force majeure on its entire 30-inch diameter pipeline spanning from Uniontown, Pennsylvania, to Kosciusko, Mississippi. The force majeure could reduce throughput capacity at Uniontown from 4.2 Bcf/d to 2.5 Bcf/d, according to estimates from Genscape.