For natural gas report week September 10, 2020, the EIA reported a net increase in storage of 70 Bcf. The build was in line with forecasts of injections ranging from 59 Bcf to 83 Bcf, averaging 69 Bcf. Last year for the same week there was an injection of 80 Bcf and the five-year average is 68 Bcf.
Working gas in storage was 3,525 Bcf as of Friday, September 4th, 2020 per EIA estimates. Inventory was 528 Bcf (17.6%) higher than last year for the same week and 409 Bcf (13.1%) more than the five-year average of 3,116 Bcf.
Natural Gas Market Recap
October NYMEX
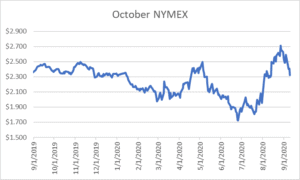
Settled Thursday at $2.323/Dth down 8.3 cents from Wednesday’s close at $2.406/Dth.
12 Month Strip
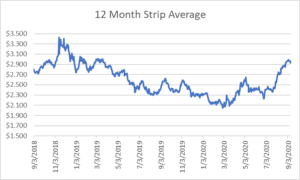
Settled Thursday at $2.925/Dth, down 4.4 cents from the prior week.
Seasonal Strips
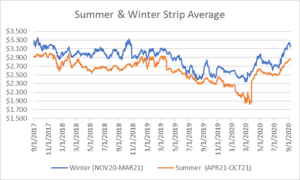
The winter strip (NOV20-MAR21) settled Thursday at $3.144/Dth, down 7.5 cents from the week prior. Looking forward to next summer (APR21-OCT21), the strip settled Thursday at $2.848/Dth, up less than a penny from the week prior.
Natural Gas Weekly
Natural Gas Report – September 10, 2020
Natural Gas Fundamentals
Overall supply averaged 92.8 Bcf/d last week as production grew by 0.7%. Meanwhile, imports from Canada fell by 19.4%.
The average rate of injections into storage is 7% more than that of the five-year average for this point in the refill season. If the injection rate matched the five-year average of 10.6 Bcf/d through the end of refill season (October 31st), withdrawal season would begin with 4,132 Bcf in storage, which is 409 Bcf higher than the five-year average of 3,723 Bcf.
Total demand fell by 3.9% from the prior report week, averaging 81.1 Bcf/d. Power generation and residential-commercial consumption declined by 7.8% and 0.1%, respectively. Industrial demand grew by 1.8% and exports to Mexico dropped by 1.8%.
LNG pipeline receipts are up by 1.8 Bcf/d. Six LNG vessels with a combined carrying capacity of 21 Bcf departed the U.S. between September 3 and September 9, 2020.
The number of rigs in operation grew by 21, up to 294 according to data from Enverus. Baker Hughes rig data shows natural gas specific rigs remained flat at 72.
Natural Gas Prices
Following the holiday weekend, prompt month prices dropped roughly 18 cents. Part market correction, part response to fundamentals, the 12-month and winter strips also posted losses week over week with the 2021 summer strip holding steady. With 7 weeks left of injection season and upcoming injections forecast in alignment with the five-year average, it looks like we’ll begin withdrawal season at a surplus to the five-year average. Yet prices remain unfavorably low for producers who have been forced to tighten up supply amid declining profitability. With domestic demand stabilizing and expectations for continued growth in LNG exports, there’s enough to justify some price support. However, with crude oil inventory excess, the EIA expects drilling activity will remain low through the first half of 2021 before increasing toward the end of year. The potential impact to associated natural gas production may have an amplifying effect on price support.