For natural gas report week September 17, 2020, the EIA reported a net increase in storage of 89 Bcf. The build exceeded forecasts of injections ranging from 68 Bcf to 86 Bcf, averaging 80 Bcf. Last year for the same week there was an injection of 82 Bcf and the five-year average is 77 Bcf.
Working gas in storage was 3,614 Bcf as of Friday, September 11th, 2020 per EIA estimates. Inventory was 535 Bcf (17.4%) higher than last year for the same week and 421 Bcf (13.2%) more than the five-year average of 3,193 Bcf.
Natural Gas Market Recap
October NYMEX
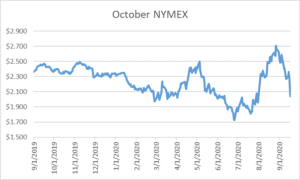
Settled Thursday at $2.042/Dth down 22.5 cents from Wednesday’s close at $2.267/Dth.
12 Month Strip
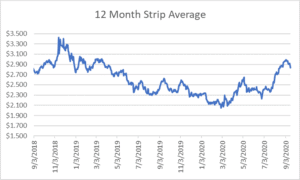
Settled Thursday at $2.836/Dth, down 8.9 cents from the prior week.
Seasonal Strips
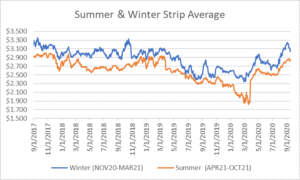
The winter strip (NOV20-MAR21) settled Thursday at $3.033/Dth, down 11.1 cents from the week prior. Looking forward to next summer (APR21-OCT21), the strip settled Thursday at $2.811/Dth, down 3.7 cents from the week prior.
Natural Gas Weekly
Natural Gas Report – September 17, 2020
Natural Gas Fundamentals
Overall supply averaged 91.7 Bcf/d last week with production falling by 1.5%. Meanwhile, imports from Canada increased by 7.2%.
The average rate of injections into storage is 7% more than that of the five-year average for this point in the refill season. If the injection rate matched the five-year average of 10.6 Bcf/d through the end of refill season (October 31st), withdrawal season would begin with 4,144 Bcf in storage, which is 421 Bcf higher than the five-year average of 3,723 Bcf.
Total demand fell by 3.0% from the prior report week, averaging 81.1 Bcf/d. Power generation and exports to Mexico declined by 6.3% and 5.7%, respectively. Industrial demand grew by 0.4% and residential-commercial increased by 2.7%.
LNG pipeline receipts are up by 2.4 Bcf/d, averaging 7.0 Bcf/d. Eleven LNG vessels with a combined carrying capacity of 41 Bcf departed the U.S. between September 10 and September 16, 2020.
The number of rigs in operation grew by five, up to 294 according to data from Enverus. Baker Hughes rig data shows natural gas specific rigs decreased by one from last week, down to 71.
Natural Gas Prices
Although prices fell across the board, it was most pronounced in spot and prompt month prices as well as in the upcoming winter strip as cooler weather led to decreased demand.
According to the EIA, temperatures averaged 65–70 degrees across most of the Lower 48 states, leading to lower consumption for power generation. Additionally, this week’s injection of 89 Bcf exceeded both last year’s injection and the five-year average as well as market expectations. The injection appears to have been the primary factor in the price drop, particularly for prompt month prices, as most of the decline occurred within the hour following the EIA’s publication of weekly storage numbers.
Can We Talk Risk?
That’s the thing about risk – if you knew what was going to happen, there wouldn’t be much risk involved, right? You’d know what was going to happen and plan accordingly.
But in a year that’s brought us a global pandemic, global lockdowns and natural gas demand destruction, negative oil prices, murder hornets, record breaking wildfires, and fire tornadoes, if one thing should be clear, it’s that not much is really all that certain.
Energy prices aren’t immune to turbulent current events. Read on for more about how to understand price risk in light of such uncertainty.