
For natural gas report week September 2, 2021, the EIA reported a net increase in storage of 20 Bcf. The injection was in line with forecasts which ranged from 13 Bcf to 34 Bcf and averaged 24 Bcf. In comparison, last year for the same week there was an injection of 36 Bcf and the five-year average is an injection of 53 Bcf.
Working gas in storage was 2,871 Bcf as of Friday, August 27, 2021 per EIA estimates. Inventory was 579 Bcf (-16.8%) less than last year for the same week and 222 Bcf (-7.2%) below the five-year average of 3,093 Bcf.
Natural Gas Market Recap
October NYMEX
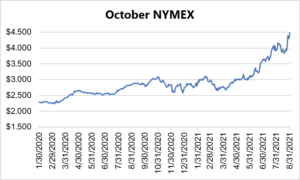
October NYMEX: October settled Thursday at $4.641/Dth up 2.6 cents from Wednesday’s close at $4.615/Dth.
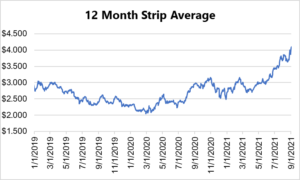
12 Month Strip
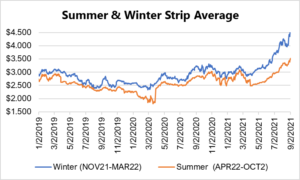
Seasonal Strips
Natural Gas Report – September 2, 2021
Fundamentals
Overall supply averaged 96.7 Bcf/d last week as production decreased by 2.4% and imports from Canada remained consistent at 5.1 Bcf/d.
Total demand dropped by 1.4% from the prior report week, averaging 91.6 Bcf/d. Residential-commercial use remained steady while power generation demand fell by 2.3%. Meanwhile, LNG pipeline receipts averaged 10.5 Bcf/d, remaining steady week over week.
Up to this point in injection season, the average rate of injections is 15% lower than the five-year average. If the rate of injections matched the five-year average of 9.6 Bcf/d, inventory would be 3,497 Bcf at the close of refill season. That’s 222 Bcf lower than the five-year average of 3,719 Bcf.
Natural Gas Prices
As anticipated, prices went up across the board. Extensive power outages and decreased need for cooling resulted in a 1.0 Bcf/d decline in power generation consumption, but the overall demand drop (0.8 Bcf/d) was insufficient to offset production shortfalls (down 2.2 Bcf/d, week over week).
DEC21, settled at $4.780/Dth, up 42.0 cents
JAN22, settled at $4.798/Dth, up 37.9 cents
FEB22, settled at $4.683/Dth, up 35.2 cents
MAR22, settled at $4.351/Dth up 33.2 cents
APR22, settled at $3.581/Dth up 18.1 cents
Strips
24 Month, settled at $3.683/Dth up 12.5 cents
36 Month, settled at $3.421/Dth up 7.7 cents
Hurricane Ida and Natural Gas – Update
Last week we examined the impact Ida would have on natural gas production. Short term, emergency response required evacuation of crews from the region’s oil and gas rigs. While this is typical for Gulf hurricanes that threaten rigs and pipeline, what’s not typical is the slow return to normal.
Ida made landfall on Sunday, August 29th. At that time, 93.75% of the region’s natural gas production was closed down, according to the Federal Bureau of Safety and Environmental Enforcement. By Wednesday, energy producers struggled to restart amid widespread destruction, power outages, and water shortages. According to Reuters, “Damaged roads, power and transport facilities slowed efforts to complete aerial surveys of offshore platforms and pipelines three days after the storm tore through the Gulf of Mexico.”
As a result, of the 288 oil and gas platforms evacuated prior to the storm, only 39 had resumed operations as of Wednesday. To this end, 1.88 Bcf remained offline.
While some experts have suggested that gasoline prices are unlikely to spike in response to the production halts, natural gas has run a tight supply/demand balance throughout injection season. And now as we are just over eight weeks shy of the start of withdrawal season, the slows in production and smaller injections have proven bullish for prices. Recovery efforts may help relieve some of the immediate attention to the anemic injections, but it’s unlikely to ease apprehension about the storage deficit to the five-year average this close to the end of a disappointing injection season.
Do you have the best natural gas contract for your business?
We can help you evaluate your current contract and explore your natural gas buying options. Call us at 866-646-7322 for a no-cost, no-obligation analysis today.