
For natural gas report week September 9, 2021, the EIA reported a net increase in storage of 52 Bcf. The injection was toward the high end of forecasts which ranged from 30 Bcf to 58 Bcf and averaged 42 Bcf. In comparison, last year for the same week there was an injection of 65 Bcf and the five-year average is an injection of 65 Bcf.
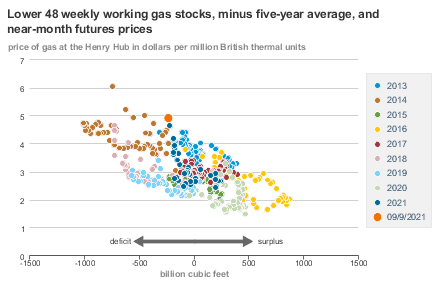
Working gas in storage was 2,923 Bcf as of Friday, September 3, 2021 per EIA estimates. Inventory was 592 Bcf (-16.8%) less than last year for the same week and 235 Bcf (-7.4%) below the five-year average of 3,158 Bcf.
Natural Gas Market Recap
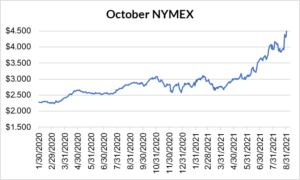
October NYMEX
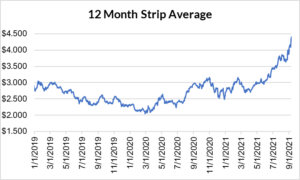
12 Month Strip
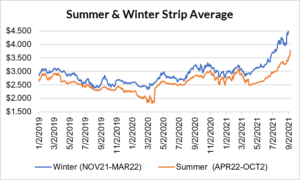
Seasonal Strips
Natural Gas Report – September 9, 2021
Fundamentals
Overall supply averaged 95.5 Bcf/d last week as production decreased by 0.6% and imports from Canada fell by 0.6 Bcf/d.
Total demand dropped by 9.4% from the prior report week, averaging 84.7 Bcf/d. Residential-commercial slowed slightly while power generation demand fell by more than 6.0 Bcf/d. Meanwhile, LNG pipeline receipts averaged 10.9 Bcf/d, growing by 0.4 Bcf/d week over week.
Up to this point in injection season, the average rate of injections is 15% lower than the five-year average. If the rate of injections matched the five-year average of 9.7 Bcf/d, inventory would be 3,484 Bcf at the close of refill season. That’s 235 Bcf lower than the five-year average of 3,719 Bcf.
Natural Gas Prices
Although this week’s storage injection doubled that of the prior week and represents the largest weekly build since July 9th, it still resulted in an expansion in the deficit between current levels and the five-year average. So, while superficially bearish for a weekly injection total, the tight supply/demand balance in approach of withdrawal season appears to be a primary driver of prompt month and strip prices which all posted weekly gains of more than 20 cents for the second consecutive week. Early concern over winter cold and perceived storage shortfalls brought above $5 natural gas – prices not seen since 2014. That this concern is responsible for the week’s market behavior is evident in the notable difference between winter and summer strip prices.
NOV21, settled at $5.072/Dth, up 38.0 cents
DEC21, settled at $5.158/Dth, up 37.8 cents
JAN22, settled at $5.216/Dth, up 38.4 cents
FEB22, settled at $5.102/Dth, up 38.5 cents
MAR22, settled at $4.724/Dth up 37.3 cents
APR22, settled at $3.836/Dth up 25.5 cents
Strips
24 Month, settled at $3.932/Dth up 24.9 cents
36 Month, settled at $3.621/Dth up 20.0 cents
Ida‘s Enduring Impact
Last week we noted, Ida made landfall on Sunday, August 29th. At that time, 93.75% of the region’s natural gas production was closed down, according to the Federal Bureau of Safety and Environmental Enforcement (BSEE). By Wednesday, energy producers struggled to restart amid widespread destruction, power outages, and water shortages. According to Reuters, “Damaged roads, power and transport facilities slowed efforts to complete aerial surveys of offshore platforms and pipelines three days after the storm tore through the Gulf of Mexico.”
As of the morning of September 9th, BSEE reported 77.25% of the region’s natural gas production remains shut in.
Recent overflight imagery of Gulf Coast energy infrastructure has revealed extensive damage to natural gas facilities as seen in National Geodetic Survey (NGS) damage assessment images. Follow the link and zoom in for a closer look.
Straining existing supply issues, the EIA reported, “IHS Markit estimates on average 0.6 Bcf/d of natural gas production was received from the Gulf of Mexico offshore into interstate pipelines, compared with an average of 2.6 Bcf/d in the week preceding the hurricane.”
Do you have the best natural gas contract for your business?
We can help you evaluate your current contract and explore your natural gas buying options. Call us at 866-646-7322 for a no-cost, no-obligation analysis today.