.png)
Natural Gas – Week In Review
Natural gas report week September 29, 2022.
This week’s injection of 103 Bcf was at the high end of analysts’ expectations which ranged from 86 Bcf to 105 Bcf. Comparatively, last year’s injection was 86 Bcf and the five-year average of net injections is 77 Bcf. Current storage totals 2,977 Bcf which is 9.3% below the five-year average but still within the five-year historical range.
Natural Gas Weekly Fundamentals
Demand
Overall demand declined for a fourth week, losing 0.4 Bcf/d. Consumption for power generation fell by 4.4 Bcf/d while residential-commercial demand grew by 3.1 Bcf/d as cooler fall temperatures translated to a tradeoff between cooling and heating. The LNG export ship count fell by one from the prior week, totaling 20 for an overall capacity of 75 Bcf.
Production
Production grew slightly, adding only 0.2 Bcf/d over last week. The natural gas rig count dropped by two, totaling 160 rigs. Oil-directed rigs grew by 3, for a total of 602.
Storage Forecast
The average rate of injections into storage is 2% lower than the five-year average at this point in refill season (which traditionally runs April through October). If the injection rate matches the five-year average of 9.5 Bcf/d through October 31, natural gas supply will total 3,339 Bcf, 306 Bcf lower than the five-year average of 3,645 Bcf.
What's Driving Natural Gas Prices This Week?
A Bearish Week
The downward trend in natural gas prices continued for yet another week as another robust, triple digit injection and a looser supply-demand balance improved the end-of-season storage outlook. Here’s generally why:
- Fall Shoulder Season. Summer enthusiasts, I’m sorry. This is the part of the year when warmer weather shifts (gradually if we’re lucky) from mild temperatures to brisker, chilly conditions in approach of winter. During this time, natural gas demand shifts from power generation (cooling) to residential-commercial (heating). But during the weeks it’s neither hot or cold, demand is subdued. This has contributed to a more relaxed supply-demand balance and ultimately means since less of what’s being produced is used, more is going into storage.
- Ian. The hurricane hit Florida as a Category 4 storm termed the worst the state has ever seen. It left 3.5 million residents and businesses without power and as of this afternoon (September 30) 1.9 million remain as such. “In Florida, the utility with the most outages was Florida Power & Light Co (FPL). FPL said it had already restored service to over 1 million customers affected by the storm, but "anticipates some customers will face prolonged outages because portions of the electric system in Southwest Florida will need to be rebuilt rather than repaired." That downtime is expected to last weeks for those in areas where the grid was damaged beyond repair.
As Ian exited Florida and regained hurricane strength over the Atlantic, it caused a fresh wave of hurricane warnings for the Carolinas where residents were urged to prepare for costal storm surges, flooding, destructive winds and power outages. Typically, weather-related power outages require restoration that can be addressed in days. In this instance, the extent of grid damages and supply shortages will cause extended downtime. Practically, for our purpose here, that means subdued power generation demand.
Natural Gas Weekly Market Report - September 29, 2022
November NYMEX
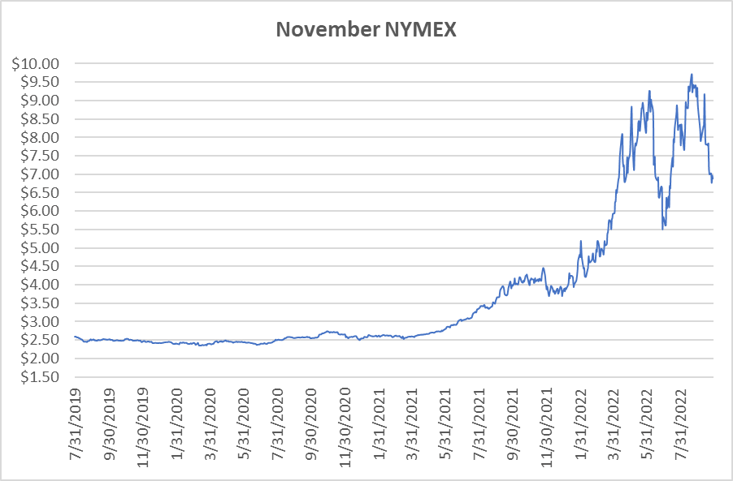
October NYMEX: Moved off the board Wednesday, September 28th, settling the month at $6.868/Dth.
November NYMEX: Settled Thursday at $6.874/Dth down 8.1 cents from Wednesday’s close at $6.955/Dth.
12 Month Strip
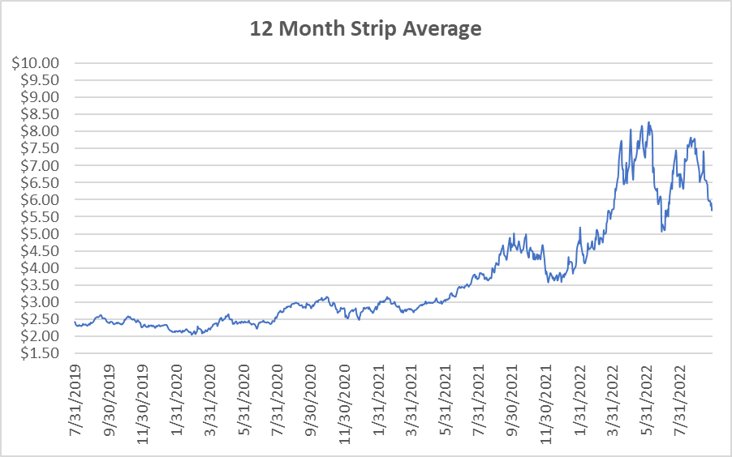
Settled Thursday at $5.688/Dth, down 37.5 cents from the prior week.
Seasonal Strips
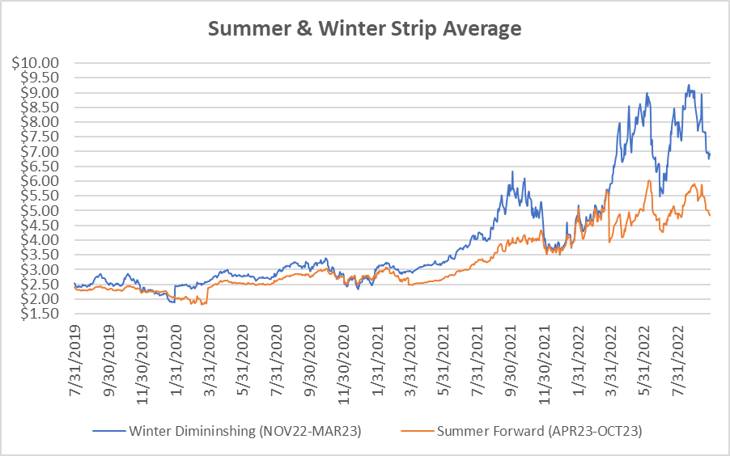
The winter strip (NOV22-MAR23) settled Thursday at $6.882/Dth, down 23.8 cents from last week while the summer strip (APR23-OCT23) settled at $4.834/Dth, down 19.0 cents from last week.
Calendar Years 2022/2023/2024
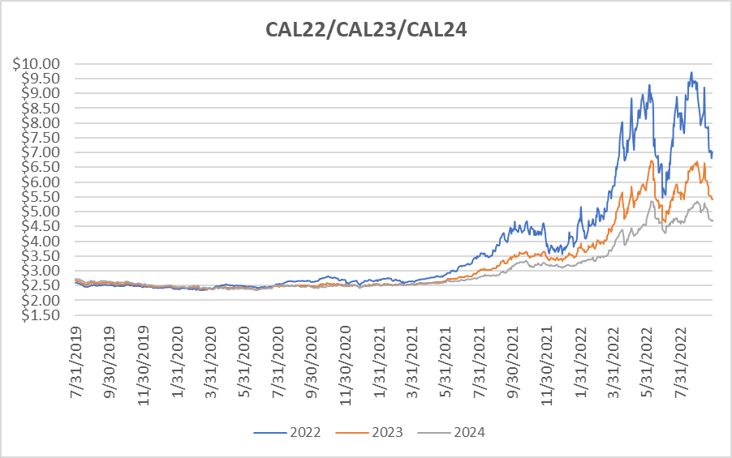
CY22 settled Thursday at $7.008/Dth, down 21.2 cents from the prior week.
CY23 settled Thursday at $5.404/Dth, down 18.6 cents from the prior week.
CY24 settled Thursday at $4.713/Dth, down 7.2 cents from the prior week.
Crude Oil
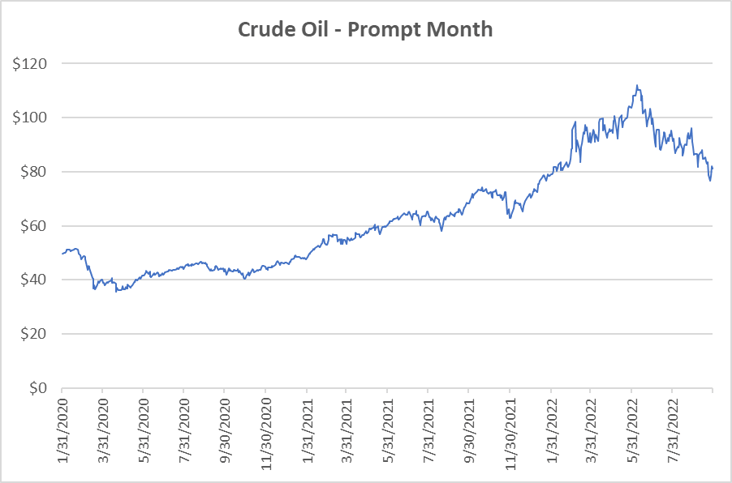
Settled Thursday at $81.23/barrel, down $2.260 from the prior week.
Need Help Making Sense of Natural Gas Prices?
We can help you manage risk and navigate the current price volatility. We’ll evaluate your current contract and explore your natural gas buying options.
Call us at 866-646-7322 for a no-cost, no-obligation analysis today.