.png)
Natural gas report week, May 5, 2022.
This week’s injection of 77 Bcf was in line with analysts’ expectations which ranged from 56-81 Bcf. With production consistent week-over-week and demand steady, this week’s storage report appears misaligned with market prices which have not been this high since 2008.
If you aren’t one for getting wrapped up in reading weekly market numbers that’s okay. This week, this one’s for you. A quick glance at the graphs should tell you most of what you need to know about what happened. Prices didn’t simply gain week-over-week, they shot up. Dramatically. Normally we write these reports in terms of cents, not this week.
What the graphs can’t answer is why. For the highlights and additional price insights, continue reading.
Natural Gas Weekly Fundamentals
Not Since 2008… Throughout the last week, the media has capitalized on skyrocketing natural gas prices as stories of an extreme nature tend to command attention. They’ve pointed to 2008 as the last time natural gas prices were this high at this time of the year. And as promised last week, we’ll take a closer look at what happened in 2008 when prices spiked at the beginning of the year before trending downward beginning in July of that year.
According to a 2009 CRS report to Congress, “The year began with a relatively tight demand/supply balance, and this generated upward spot price movement. For the 2007-2008 heating season, the Energy Information Administration (EIA) reported a price increase of more than 30% (beginning to end of season). The key “benchmark” price for the United States, the Henry Hub spot price, generally rose through the first half of 2008 to a peak of $13.32 per million British thermal units (Btu) on July 3, 2008. By the end of 2008, the Henry Hub spot price had decreased 56% to $5.83 per million Btu, lower than the $7.83 per million Btu price on January 2, 2008.”
Likewise, at this time, economic challenges aggravated natural gas price stability.
What ultimately led to the turnaround?
- Increased natural gas production (10%).
- Declining power burn.
- Subdued LNG dynamics.
For now, it is unlikely we’ll find relief from 2 or 3 and 1 may be slow to change.
However, Since 2008… much has changed. And of course now, there’s little agreement as to the cause. A CBS report this week maintains low storage is responsible for recent price movement , “A drop in the U.S. supply of natural gas kept in storage is driving the recent price spike.” While that might be true in a general sense, storage totals have been trending away from the five-year range since January without this impact on prices. The same CBS report claims the Russian Ukraine conflict is a “minor factor.”
I’m not so sure about that.
According to analysis published by Fortune, “Natural gas prices in the U.S. have more than doubled since Russia, supplier of 17% of the world’s natural gas and the largest gas exporter in 2020, invaded Ukraine in February.” Even though that much is accurate, it is also nothing new. As the article indicates, this has been going on since February which again fails to explain what changed specifically this week that’s inflamed natural gas markets.
How About Option C, All Of The Above?
Yes, we entered into injection season with a tight supply-demand balance. And, yes, the war in Ukraine is keeping LNG demand high as Europe moves away from Russian energy reliance. But if we push into this a little and try to understand what changed this week, we return to fundamentals.
It’s going to be warm for the next two weeks, with above-average temperatures forecast for much of the country. That drives cooling demand which in turn increases demand for natural gas used in power generation.
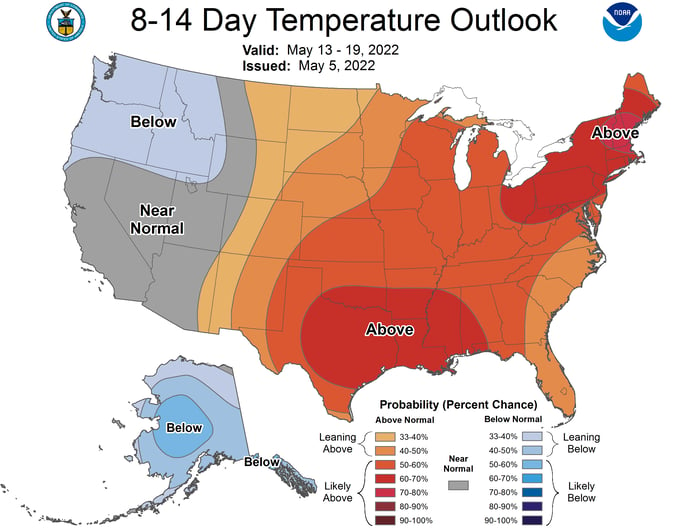
From https://www.cpc.ncep.noaa.gov/products/predictions/814day/814temp.new.gif
Previously, with natural gas prices this high, we would have turned to coal as a more affordable source of power generation. However recent coal plant retirements and dwindling coal supplies have all but eliminated this alternative. Reliance on natural gas will remain high.
With infrastructure limitations, material supply issues, and staff shortfalls, hopes for sufficient increases to natural gas production may go deferred until Spring 2023.
Natural Gas Market Report – May 5, 2022
June NYMEX
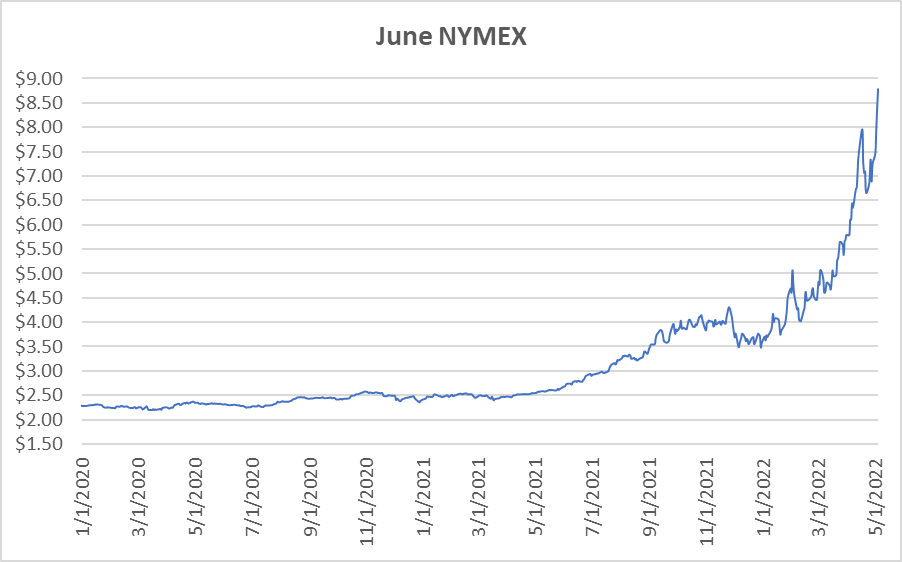
June settled Thursday at $8.783/Dth, up 36.8 cents from Wednesday’s close at $8.415/Dth and up $1.895 over the prior week.
12 Month Strip
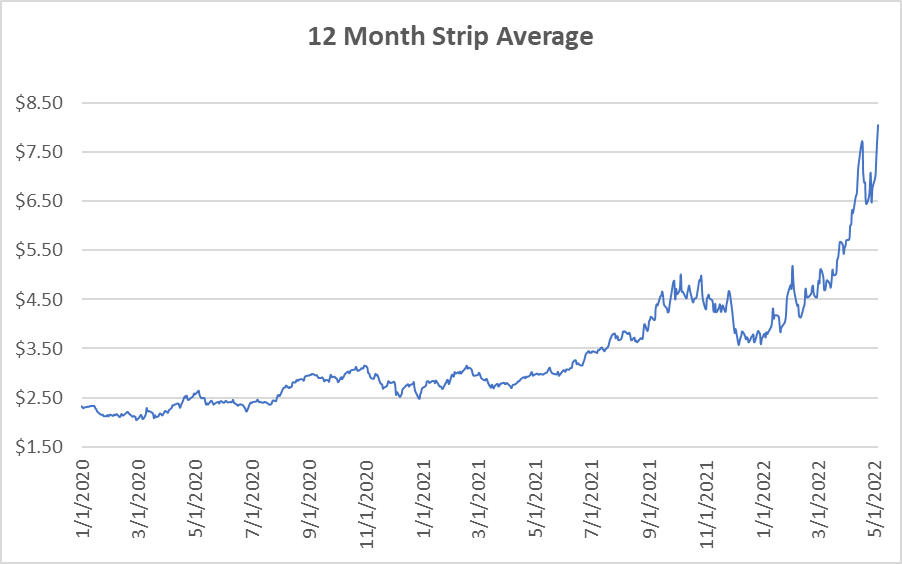
Settled Thursday at $8.059/Dth, up $1.573 from the prior week.
Seasonal Strips
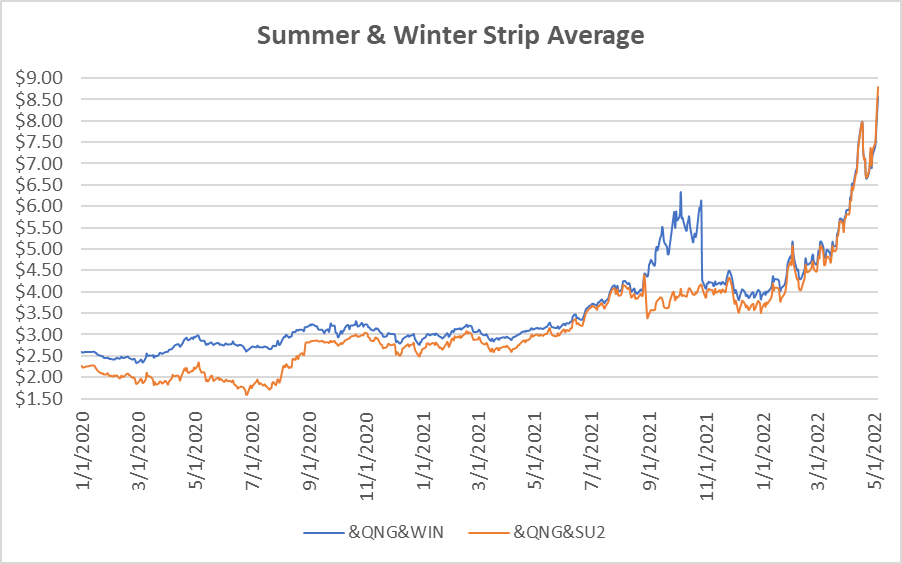
The summer strip (JUN22-OCT22) settled at $8.797/Dth, up $1.839 from the week prior. The winter forward (NOV22-MAR23) settled Thursday at $8.551/Dth, up $1.660 from the week prior.
Calendar Years 2022/2023/2024
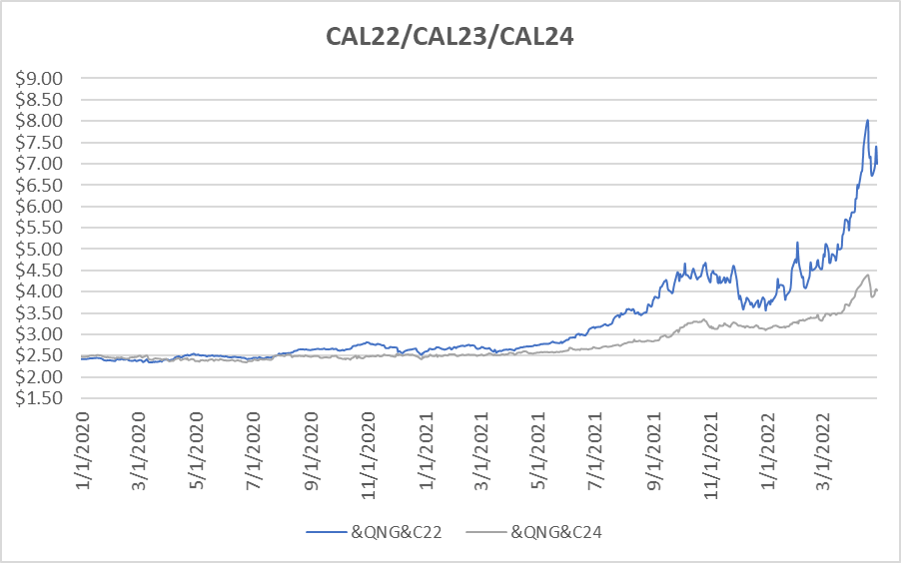
CY22 settled Thursday at $8.823/Dth, up $1.82 from the prior week.
CY23 settled Thursday at $5.839/Dth, up 88.1 cents from the prior week.
CY24 settled Thursday at $4.454/Dth, up 41.8 cents from the prior week.
Crude Oil
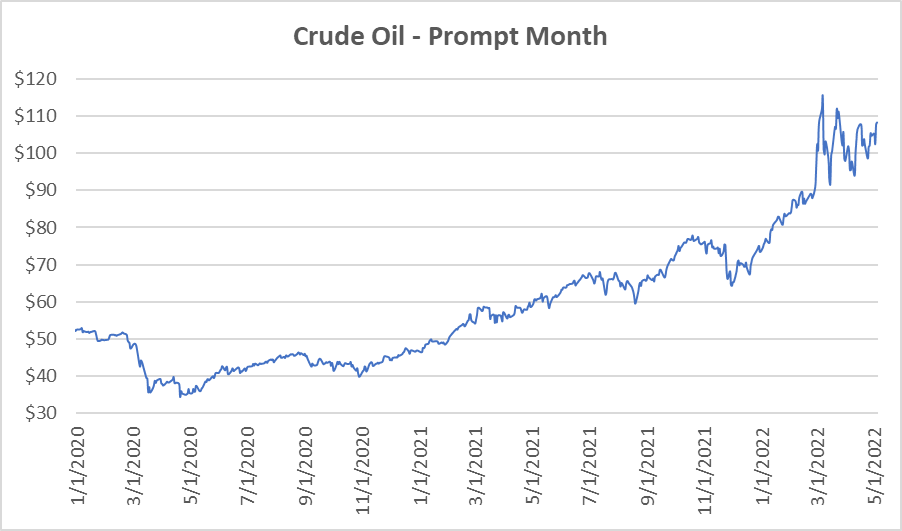
Settled Thursday at $108.26/barrel, up $2.90 from the prior week.
Need Help Making Sense of Natural Gas Prices?
Give us a call. We can help you manage risk and navigate the current price volatility.
We’ll evaluate your current contract and explore your natural gas buying options.
Call us at 866-646-7322 for a no-cost, no-obligation analysis today.