.png)
Natural Gas – Week In Review
Natural gas report week, June 16, 2022.
This week’s injection of 92 Bcf was in line with analysts’ expectations which ranged from 79 Bcf - 96 Bcf. Comparatively, last year’s injection was 28 Bcf and the five-year average of net injections is 79 Bcf. Current storage totals 2,095 Bcf which is 13.4% below the five-year average.
Remember the natural gas market whiplash-roller-coaster-ride we mentioned last week? Seems that ride won’t be coming to a stop in the near future. After last week’s high prices, and despite above-average temperatures throughout the report week, prices plummeted on Tuesday. Superficially, that might make little sense. After all, this week’s supply-demand numbers and warm weather would have been indicators for higher prices, but that’s not what happened.
Natural Gas Weekly Fundamentals
Demand- Total demand up 3.8 Bcf/d from last week, with the largest increase in consumption coming from power generation (5.7 Bcf/d). The hit to LNG caused by the Freeport fire became evident in pipeline receipts this week, down from 12.5 Bcf/d to 10.7 Bcf/d.
Production – Production remained steady week-over-week as imports from Canada once again arrived to meet regional demand.
Storage Forecast –The average rate of injections into storage is 6% lower than the five-year average at this point in refill season (which traditionally runs April through October). If the rate of injections matches the five-year average of 8.6 Bcf/d through October 31, natural gas supply will total 3,322 Bcf, 323 Bcf lower than the five-year average of 3,645 Bcf.
Natural Gas Price Outlook
Freeport LNG
Since this will impact LNG exports for the upcoming months, it’s worth spending a few minutes understanding what Freeport is and why the fire here matters.
Freeport LNG is a natural gas liquefaction and LNG export facility in Houston, Texas. Liquefied natural gas (LNG) is natural gas that has been cooled to -260 F. The change in state from gas to liquid reduces the volume of the gas by almost 600 times and makes it possible to store and ship natural gas.
The ability to transport LNG allows the United States to export natural gas. According to the EIA, in 2021, “U.S. LNG exports reached a record high of about 3,561 Bcf to 45 countries, and LNG exports accounted for 54% of total U.S. natural gas exports. About half of LNG exports went to five countries in 2021.”
While demand for U.S. LNG was at an all-time high, the escalating conflict between Russia and Ukraine highlighted the importance of European energy independence from Russia. Europe relied on Russia to satisfy as much as 40% of its natural gas demand, even though the amount Russia actually shipped was dwindling in the months leading up to the conflict. To this end, shipments of U.S. LNG quickly became part of the answer. However, strained to maximum capacity, and with few new LNG terminals projected to complete in the near future, U.S. ability to meet European demand is limited.
To this end, Freeport figures significantly into how much LNG the U.S. can export to Europe. Exports from the Freeport LNG terminal averaged 2.0 Bcf/d from January to May 2022. Additionally, “Freeport has been operating at high utilization rates this year. During January–May 2022, Freeport’s utilization averaged 92% of peak capacity, compared with an 86% peak capacity utilization during the same period last year and an annual average of 87% in 2021, according to EIA estimates.”
As such, on June 8th, when a fire at the Freeport plant led to the facility’s shutdown, domestic natural gas markets retreated on expectations the then-estimated three week shut down would mean additional natural gas going into storage. That morning, the front month opened at $9.312/Dth and ended up closing the day down more that 65.0 cents at $8.660/Dth. Nonetheless, with the initial Freeport closure expected to last three weeks, price declines were likewise limited and prompt month trading again climbed above $9 on Monday this week.
However, that changed this Tuesday when Freeport announced that partial operations may resume in ninety days and full operations are not expected, at best, until the end of 2022. Following the announcement, prices resumed their retreat from the prior week.
Whether or not the natural gas additions to domestic storage could be sufficient to erase the deficit to the five-year average is something we will examine in future reports.
Natural Gas Market Report – June 16, 2022
July NYMEX
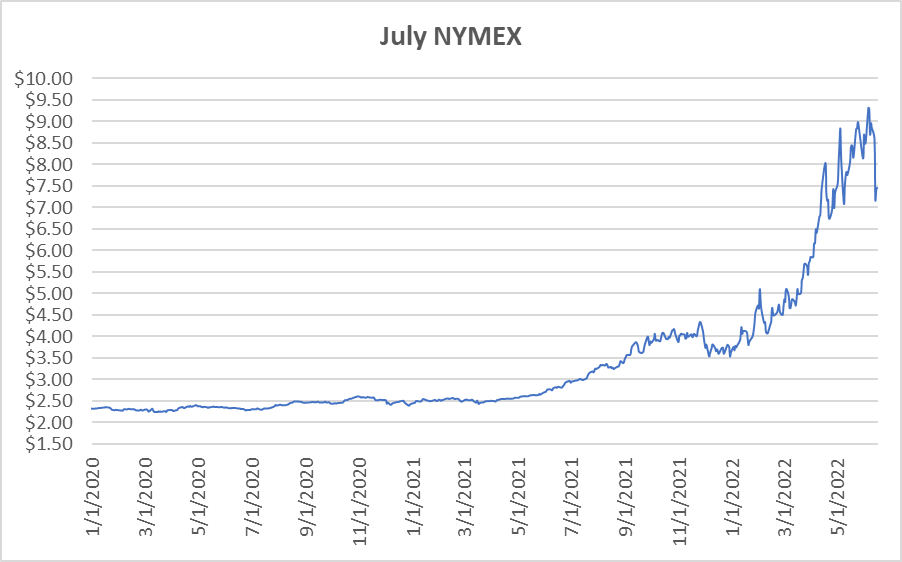
July settled Thursday at $7.464/Dth, up 4.4 cents from Wednesday’s close at $7.420/Dth, but down $1.499 over the prior week.
12 Month Strip
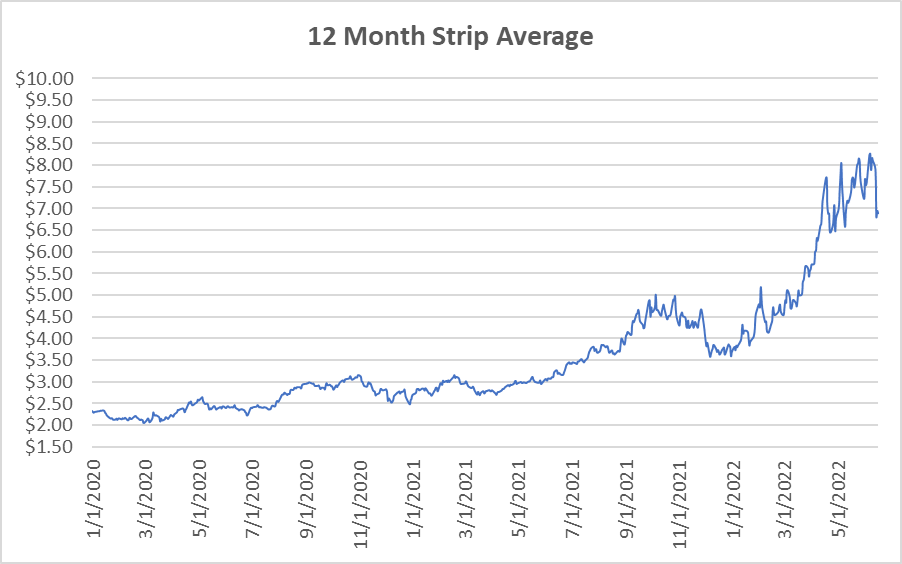
Settled Thursday at $6.897/Dth, down $1.278 from the prior week.
Seasonal Strips
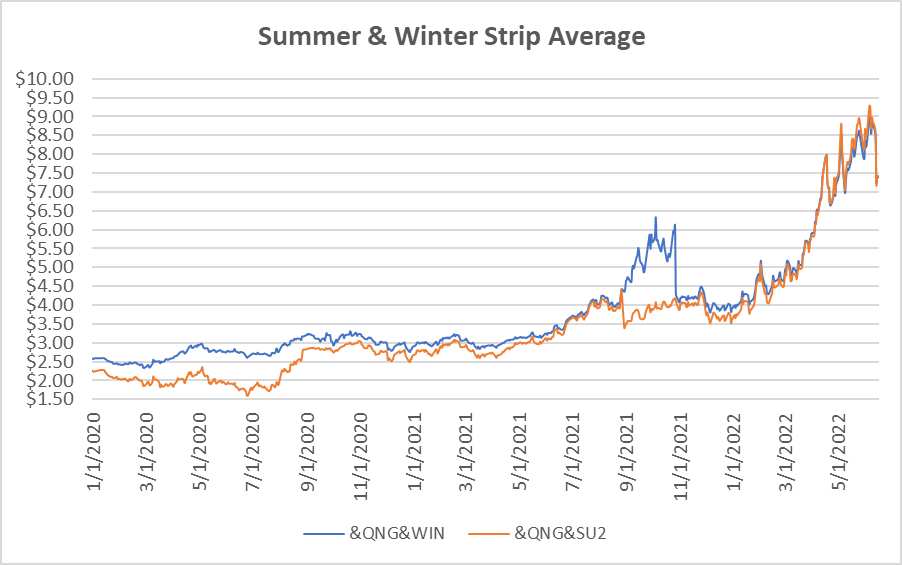
The summer strip (JUL22-OCT22) settled at $7.420/Dth, down $1.544 from the week prior. The winter forward (NOV22-MAR23) settled Thursday at $7.388/Dth, down $1.473 from the week prior.
Calendar Years 2022/2023/2024
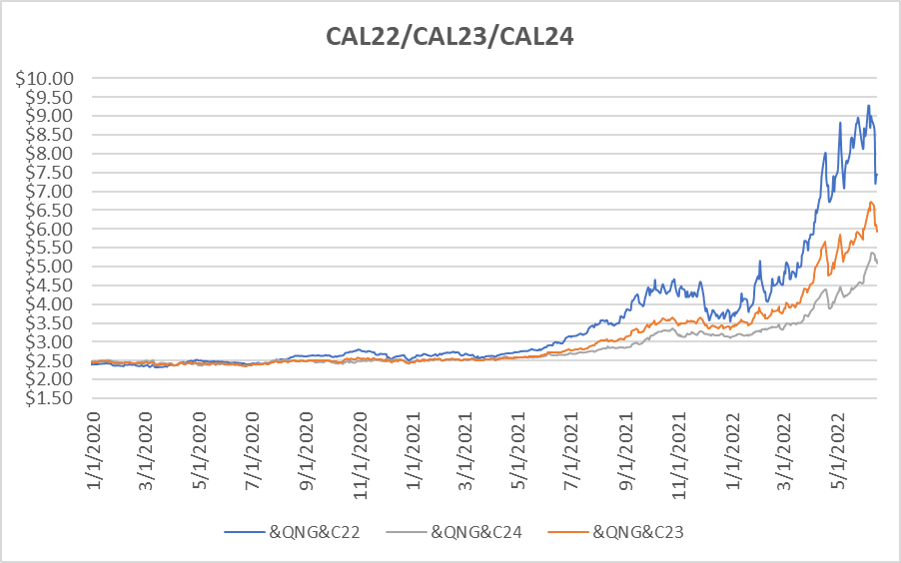
CY22 settled Thursday at $7.455/Dth, down $1.541 from the prior week.
CY23 settled Thursday at $5.939/Dth, down 76.5 cents from the prior week.
CY24 settled Thursday at $5.085/Dth, down 24.7 cents from the prior week.
Crude Oil
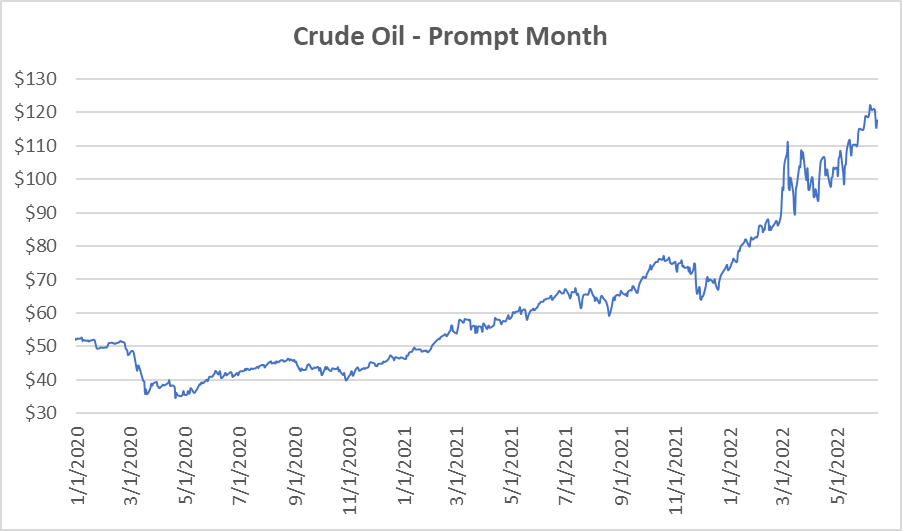
Settled Thursday at $117.59/barrel, down $3.92 from the prior week.
Need Help Making Sense of Natural Gas Prices?
Give us a call. We can help you manage risk and navigate the current price volatility.
We’ll evaluate your current contract and explore your natural gas buying options.
Call us at 866-646-7322 for a no-cost, no-obligation analysis today.